JAI BALAJI INDUSTRIES LTD. - Jai Balaji Group
JAI BALAJI INDUSTRIES LTD. - Jai Balaji Group
JAI BALAJI INDUSTRIES LTD. - Jai Balaji Group

Create successful ePaper yourself
Turn your PDF publications into a flip-book with our unique Google optimized e-Paper software.
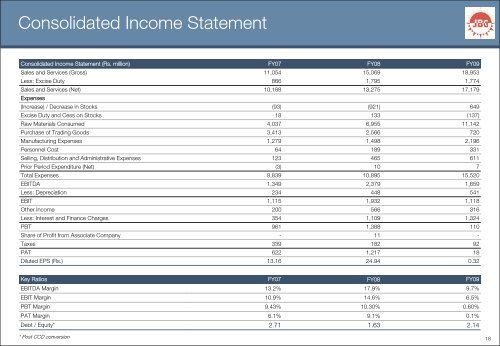
Consolidated Income Statement<br />
Consolidated Income Statement (Rs. million) FY07 FY08 FY09<br />
Sales and Services (Gross) 11,054 15,069 18,953<br />
Less: Excise Duty 866 1,795 1,774<br />
Sales and Services (Net) 10,188 13,275 17,179<br />
Expenses<br />
(Increase) / Decrease in Stocks (93) (921) 649<br />
Excise Duty and Cess on Stocks 18 133 (137)<br />
Raw Materials Consumed 4,037 6,955 11,142<br />
Purchase of Trading Goods 3,413 2,566 720<br />
Manufacturing Expenses 1,279 1,498 2,196<br />
Personnel Cost 64 189 331<br />
Selling, Distribution and Administrative Expenses 123 465 611<br />
Prior Period Expenditure (Net) (3) 10 7<br />
Total Expenses 8,839 10,895 15,520<br />
EBITDA 1,349 2,379 1,659<br />
Less: Depreciation 234 448 541<br />
EBIT 1,115 1,932 1,118<br />
Other Income 200 566 316<br />
Less: Interest and Finance Charges 354 1,109 1,324<br />
PBT 961 1,388 110<br />
Share of Profit from Associate Company - 11 -<br />
Taxes 339 182 92<br />
PAT 622 1,217 18<br />
Diluted EPS (Rs.) 13.16 24.94 0.32<br />
Key Ratios FY07 FY08 FY09<br />
EBITDA Margin 13.2% 17.9% 9.7%<br />
EBIT Margin 10.9% 14.6% 6.5%<br />
PBT Margin 9.43% 10.30% 0.60%<br />
PAT Margin 6.1% 9.1% 0.1%<br />
Debt / Equity* 2.71 1.63 2.14<br />
* Post CCD conversion<br />
18