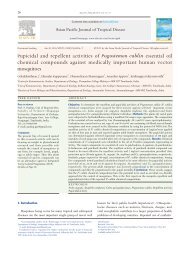
Phytochemical analysis and standardization of Strychnos nux ...
Phytochemical analysis and standardization of Strychnos nux ...
Phytochemical analysis and standardization of Strychnos nux ...

Create successful ePaper yourself
Turn your PDF publications into a flip-book with our unique Google optimized e-Paper software.
S58<br />
HPTLC method, <strong>and</strong> the sellected solvent system toluene:<br />
ethyl acetate: diethyl amine (70:20:10) was found suitable<br />
for quantitative <strong>analysis</strong>. Analysis shows that total no <strong>of</strong><br />
spot was seven, respective Rf (0.14, 0.24, 0.32, 0.43, 0.51, 0.62)<br />
Maximum peak height (17.4, 12.8, 330.1, 47.0, 334.1, 49.0,<br />
18.9) <strong>and</strong> Peak area (%) (1.69, 0.94, 33.76, 5.11, 47.15, 7.57,<br />
3.77). For quantitative <strong>analysis</strong> through HPTLC techniques,<br />
optimization <strong>of</strong> solvent system was done using combination<br />
<strong>of</strong> solvent system <strong>of</strong> varying polarity <strong>and</strong> the most suitable<br />
solvent system was found to be toluene: Ethyl acetate:<br />
Diethyl amine (70:20:10). Quantitative <strong>analysis</strong> was performed<br />
through HPTLC techniques using strychnine <strong>and</strong> brucine as<br />
st<strong>and</strong>ard marker compound in the <strong>Strychnos</strong> <strong>nux</strong>-vomica.<br />
Content <strong>of</strong> strychnine <strong>and</strong> brucine were found to be 4.75%<br />
<strong>and</strong> 3.91%. HPTLC photograph <strong>of</strong> st<strong>and</strong>ard strychnine <strong>and</strong><br />
brucine <strong>and</strong> <strong>Strychnos</strong> <strong>nux</strong>-vomica extract were presented<br />
in the Figure 1. The respective HPTLC chromatogram <strong>of</strong><br />
strychnine <strong>and</strong> brucine <strong>and</strong> <strong>Strychnos</strong> <strong>nux</strong>-vomica extract<br />
were presented in the Figure 2 <strong>and</strong> Figure 3. In the present<br />
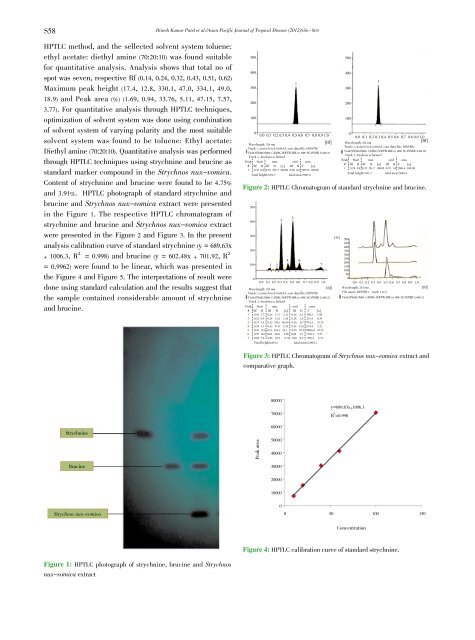
<strong>analysis</strong> calibration curve <strong>of</strong> st<strong>and</strong>ard strychnine (y = 689.63x<br />
+ 1006.3, R² = 0.998) <strong>and</strong> brucine (y = 602.48x + 701.92, R²<br />
= 0.9962) were found to be linear, which was presented in<br />
the Figure 4 <strong>and</strong> Figure 5. The interpretations <strong>of</strong> result were<br />
done using st<strong>and</strong>ard calculation <strong>and</strong> the results suggest that<br />
the sample contained considerable amount <strong>of</strong> strychnine<br />
<strong>and</strong> brucine.<br />
Strychnine<br />
Brucine<br />
<strong>Strychnos</strong> <strong>nux</strong>-vomica<br />
Figure 1: HPTLC photograph <strong>of</strong> strychnine, brucine <strong>and</strong> <strong>Strychnos</strong><br />
<strong>nux</strong>-vomica extract<br />
Dinesh Kumar Patel et al./Asian Pacific Journal <strong>of</strong> Tropical Disease (2012)S56-S60<br />
500<br />
400<br />
300<br />
200<br />
100<br />
0<br />
0.0 0.1 0.2 0.3 0.4 0.5 0.6 0.7 0.8 0.9 1.0<br />
[Rf]<br />
Wavelength: 254 nm<br />
Track: 1, noise level: 0.656AV, raw data file: DINSTR1<br />
V4.06 S/N:0612A004 CAMAG SOFTWARE (c) 1998 SCANNER 3: 061121<br />
Track 1, Analysia a: ba5mcl<br />
Peak Start max end area<br />
# Rf H Rf H [%] Rf H F [%]<br />
1 0.47 0.0 0.52 252.3 100.00 0.56 0.6 7097.0 100.00<br />
Total helght=252.3 total area=7097.0<br />
1<br />
500<br />
400<br />
300<br />
200<br />
100<br />
1<br />
0<br />
0.0 0.1 0.2 0.3 0.4 0.5 0.6 0.7 0.8 0.9 1.0<br />
[Rf]<br />
Wavelength: 254 nm<br />
Track: 2, noise level: 0.656AV, raw data file: DINSTR1<br />
V4.06 S/N:0612A004 CAMAG SOFTWARE (c) 1998 SCANNER 3: 061121<br />
Track 2, Analysia a: ba5mcl<br />
Peak Start max end area<br />
# Rf H Rf H [%] Rf H F [%]<br />
1 0.28 0.8 0.32 261.7 100.00 0.35 1.8 5684.4 100.00<br />
Total helght=261.7 total area=5684.4<br />
Figure 2: HPTLC Chromatogram <strong>of</strong> st<strong>and</strong>ard strychnine <strong>and</strong> brucine.<br />
500<br />
400<br />
300<br />
200<br />
100<br />
0<br />
1<br />
0.0 0.1 0.2 0.3 0.4 0.5 0.6 0.7 0.8 0.9 1.0<br />
Wavelength: 254 nm<br />
[Rf]<br />
Track: 3, noise level: 0.656AV, raw data file: DINSTR1<br />
V4.06 S/N:0612A004 CAMAG SOFTWARE (c) 1998 SCANNER 3: 061121<br />
Track 3, Analysia a: ba5mcl<br />
Peak Start max end area<br />
# Rf H Rf H [%] Rf H F [%]<br />
1 0.10 3.7 0.14 17.3 2.11 0.16 0.1 398.2 1.89<br />
2 0.22 0.9 0.24 12.8 1.56 0.28 1.6 215.4 0.34<br />
3 0.27 1.5 0.32 330.1 40.30 0.36 0.7 7753.4 33.75<br />
4 0.38 1.1 0.43 47.0 5.74 0.45 15.6 1174.4 5.11<br />
5 0.45 15.6 0.51 344.1 42.1 0.55 10.2 10826.4 47.15<br />
6 0.55 10.2 0.62 49.0 5.96 0.68 5.7 1739.3 7.57<br />
7 0.88 3.2 0.96 18.9 2.31 1.00 0.5 865.2 3.77<br />
Total helght=819.2 total area=22963.1<br />
0.0 0.1 0.2 0.3 0.4 0.5 0.6 0.7 0.8 0.9 1.0<br />
Wavelength: 254 nm<br />
File name: DINSTR1 track 1 to 4<br />
V4.06 S/N:0612A004 CAMAG SOFTWARE (c) 1998 SCANNER 3: 061121<br />
Figure 3: HPTLC Chromatogram <strong>of</strong> <strong>Strychnos</strong> <strong>nux</strong>-vomica extract <strong>and</strong><br />
comparative graph.<br />
Peak area<br />
2<br />
3<br />
80000<br />
70000<br />
60000<br />
50000<br />
40000<br />
30000<br />
20000<br />
10000<br />
0<br />
5<br />
4 6<br />
7<br />
[AU]<br />
500<br />
450<br />
400<br />
350<br />
300<br />
250<br />
200<br />
150<br />
100<br />
50<br />
0<br />
y=689.63x+1006.3<br />
R 2<br />
=0.998<br />
0 50 100 150<br />
Concentration<br />
Figure 4: HPTLC calibration curve <strong>of</strong> st<strong>and</strong>ard strychnine.<br />
[Rf]