part7 - Cbs
part7 - Cbs
part7 - Cbs

Create successful ePaper yourself
Turn your PDF publications into a flip-book with our unique Google optimized e-Paper software.
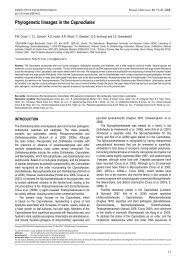
ELECTROSPRAY MASS SPECTROMETRY OF PENICILLIUM<br />
These profiles can be measured in the order of minutes<br />
and are easily adapted for automated processing,<br />
see below. Matrix effects can interfere significant in<br />
ES-MS spectra of complex mixtures, most notably by<br />
ion suppression where ions at high concentration,<br />
high surface potential or high proton affinity suppress<br />
other ions. However, it was demonstrated by Smedsgaard<br />
and Frisvad (1996) that the Penicillium species<br />
in Series Viridicata could be classified from their<br />
quite unique ES-MS spectra (mass profiles). These<br />
nominal mass spectra also showed ions corresponding<br />
to the protonated molecular mass of many of the<br />
metabolites produced by these species (Smedsgaard<br />
& Frisvad 1996). In a later study Smedsgaard & Frisvad<br />
(1997) included most species of subgenus Penicillium<br />
of which about 72% could be classified correctly<br />
(36 species out of about 50 species from 339<br />
isolates examined on two media). Although a direct<br />
infusion mass spectrum cannot in its own right be<br />
used to identify metabolites, it can give an indication<br />
of the occurrence of a particular metabolite. The major<br />
advantage of direct infusion nominal mass spectra<br />
is that they are well suited for automated data processing<br />
and most mass spectrometers comes with<br />
software for library storage and retrieval. An efficient<br />
use of standard library software was demonstrated in<br />
an extension of the above study by Smedsgaard<br />
(1997b).<br />
The most recent generation of mass spectrometers<br />
have the ability to produce high resolution spectra<br />
with a mass accuracy in the range of 5 ppm maintaining<br />
a very high sensitivity. By this accuracy only<br />
relatively few different formulae are possible for each<br />
ion seen in the spectrum, thus it is much more likely<br />
that different masses originate from different metabolites.<br />
However, reaching the high mass accuracy requires<br />
an internal mass reference. As at least one metabolite<br />
is known from most Penicillium species,<br />
these metabolites can be used as a native internal<br />
mass reference which can be used to correct the spectrum<br />
e.g. roquefortine C with the protonated mass<br />
390.1930 Da is produced by about half of the terverticillate<br />
Penicillia. These accurate high resolution<br />
mass profiles contain much more information than<br />
nominal mass spectra, thus a better chemoclassification<br />
can be expected. Furthermore, due to<br />
the high precision, only a few structures are possible<br />
for each ion (in the range of 3-9 depending on mass<br />
and accuracy) giving a much more reliable confirmation<br />
of metabolite production.<br />
Automated processing of high resolution mass<br />
spectra requires a somewhat different approach than<br />
nominal mass spectra. Whereas a series of nominal<br />
mass spectra easily can be transform into a grid structure<br />
(aligned) of integer mass without loss of information,<br />
this cannot be done as easily from accurate<br />
spectra. In an accurate spectrum the masses falls on a<br />
244<br />
continuous mass scale, therefore it is not straight forward<br />
to find out which mass compares to which. The<br />
approach mostly used is binning, where a narrow grid<br />
is designed to fit over the data in such a way that each<br />
ion in each spectrum is placed in designated bins, e.g.<br />
using a bin width of 0.1 Da will combine ion with<br />
masses in the interval 252.0000 Da to 252.1000 Da<br />
into the same bin thus to be used as one variable for<br />
further data processing. Selection of bin width depends<br />
on mass resolution and accuracy. A more efficient<br />
method is the accurate mass spectrum (AMS)<br />
distance (Hansen & Smedsgaard 2004a; 2004b) by<br />
which the similarity between both accurate and nominal<br />
spectra can be calculated without alignment of the<br />
spectra (thus without applying a grid for binning the<br />
ions into variables). In short a correspondence map is<br />
determined by matching ion peaks pairs across two<br />
spectra according to the shortest distance. For each<br />
pair of corresponding masses, the difference is<br />
calculated giving a qualitative distance measure<br />
between “matched” masses. From this vector of differences<br />
the 90% quantile is calculated, defining the<br />
distance which at least 10% of the peaks have to be<br />
moved in order to give a perfect match. Finally, the<br />
correlation is calculated between the normalised intensities<br />
for all matched peak in each pair of spectra<br />
giving a correlation of one if there is a perfect match<br />
of peak heights. The product of the distance dissimilarity<br />
and (1 minus the intensity correlation) is collected<br />
into a dissimilarity matrix for all combinations<br />
of spectra.<br />
The objective of this study was to test the classification<br />
of the 429 isolates representing 58 species belonging<br />
to subgenus Penicillium proposed by Frisvad<br />
and Samson (2004) with direct infusion ESMS accurate<br />
mass spectra.<br />
Material and methods<br />
Species from the study by Frisvad and Samson on the<br />
terverticillate Penicillia (Frisvad & Samson 2004),<br />
(58 species, approx. 8 isolates of most species, together<br />
429 isolates) were analysed by direct infusion<br />
ES-MS. Each isolate was cultivated on CYA and<br />
YES agar (Samson et al. 2004) and incubated for 7<br />
days in the dark at 25 o C. Extracts were prepared from<br />
both the CYA and YES cultures by the plug extraction<br />
procedure (Smedsgaard 1997a) modified to use a<br />
two-step extraction procedure. Three 6 mm agar<br />
plugs were extracted using 0.5 ml ethyl acetate containing<br />
0.5% formic acid in the first extraction and<br />
0.5 ml 2-propanol in the second extraction. The combined<br />
extracts was evaporated to dryness and redissolved<br />
in methanol and filtered before injection<br />
into the mass spectrometer.