A spatial, climate-determined risk rating for Scleroderris disease of ...
A spatial, climate-determined risk rating for Scleroderris disease of ...
A spatial, climate-determined risk rating for Scleroderris disease of ...

Create successful ePaper yourself
Turn your PDF publications into a flip-book with our unique Google optimized e-Paper software.
1402 Can. J. For. Res. Vol. 28, 1998<br />
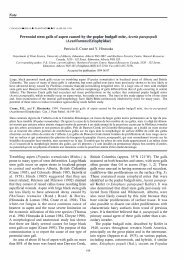
Fig. 2. Plot <strong>of</strong> the observations (small vertical bars) and modeled relationship (solid line) between probability <strong>of</strong> <strong>Scleroderris</strong><br />
occurrence (a) versus temperature in the coldest quarter with precipitation in the coldest quarter held constant at the mean and<br />
(b) versus precipitation in the coldest quarter with temperature in the coldest quarter held constant at the mean.<br />
<br />
<br />
<br />
<br />
<br />
<br />
<br />
<br />
<br />
<br />
<br />
<br />
<br />
<br />
<br />
<br />
<br />
<br />
<br />
<br />
<br />
<br />
<br />
<br />
<br />
<br />
<br />
<br />
can explain much <strong>of</strong> the distribution <strong>of</strong> <strong>Scleroderris</strong> <strong>disease</strong><br />
using mesoclimatic variables. However, with this type <strong>of</strong><br />
correlative study it is impossible to directly interpret mechanisms.<br />
Fortunately, some more local work has been conducted<br />
on the possible <strong>climate</strong> mechanisms controlling<br />
<strong>disease</strong> distribution. Marosy et al. (1989) suggested that the<br />
<strong>disease</strong> required a cold weather period <strong>of</strong> –6 to 5°C and that<br />
snow cover provided the optimum situation <strong>of</strong> a consistent<br />
temperature near 0°C. Other workers such as Laflamme<br />
(1991) have noted the effect <strong>of</strong> snow accumulation in depressed<br />
areas on creating a conducive environment <strong>for</strong> the<br />
<strong>disease</strong>. This relationship between snow accumulation and<br />
<br />
<br />
<br />
<br />
<br />
<br />
<br />
<br />
<br />
<br />
<br />
<br />
<br />
<br />
<br />
<br />
<br />
<br />
<br />
<br />
<br />
<br />
<br />
<br />
<br />
<br />
<br />
<br />
<br />
<br />
<br />
<br />
<br />
<br />
<br />
<br />
<br />
<br />
<br />
<br />
<br />
<br />
<br />
<br />
<br />
<br />
<br />
<br />
<br />
<br />
<br />
<br />
<br />
<br />
<br />
<br />
<br />
<br />
<br />
<br />
<br />
<br />
<br />
<br />
<br />
<br />
<br />
<br />
<br />
<br />
<br />
<br />
<br />
<br />
<br />
<br />
<br />
<br />
<br />
<br />
<br />
<br />
<br />
<br />
the incidence <strong>of</strong> <strong>Scleroderris</strong> <strong>disease</strong> has been observed<br />
previously in both Ontario (Martin 1964) and in northern<br />
Europe (Roll-Hansen et al. 1992; Karlman et al. 1994).<br />
In a more parsimonious model we included mean temperature<br />
<strong>of</strong> the coldest quarter as a proxy <strong>for</strong> number <strong>of</strong> conducive<br />
days. While this mean usually exceeds the lower limit<br />
<strong>of</strong> –6°C, sufficiently low temperatures ensure a lasting snow<br />
cover near the base <strong>of</strong> the tree where <strong>disease</strong> development<br />
begins. We also included the mean precipitation in the coldest<br />
quarter (usually snow), which would also relate to the<br />
availability <strong>of</strong> snow cover. This two-variable model was also<br />
a very good fit with high classification accuracy. The<br />
<br />
<br />
© 1998 NRC Canada


![Po],rell](https://img.yumpu.com/11946277/1/190x231/porell.jpg?quality=85)