Diverging Growth and Development - Biblioteca Hegoa
Diverging Growth and Development - Biblioteca Hegoa
Diverging Growth and Development - Biblioteca Hegoa

You also want an ePaper? Increase the reach of your titles
YUMPU automatically turns print PDFs into web optimized ePapers that Google loves.
Governance, institutions <strong>and</strong> growth divergence<br />
Table V.1.<br />
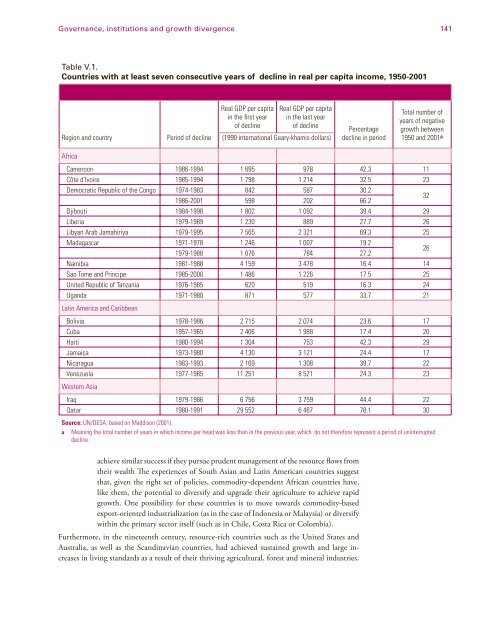
Countries with at least seven consecutive years of decline in real per capita income, 1950-2001<br />
Region <strong>and</strong> country Period of decline<br />
Real GDP per capita<br />
in the fi rst year<br />
of decline<br />
Real GDP per capita<br />
in the last year<br />
of decline<br />
(1990 international Geary-khamis dollars)<br />
achieve similar success if they pursue prudent management of the resource fl ows from<br />
their wealth Th e experiences of South Asian <strong>and</strong> Latin American countries suggest<br />
that, given the right set of policies, commodity-dependent African countries have,<br />
like them, the potential to diversify <strong>and</strong> upgrade their agriculture to achieve rapid<br />
growth. One possibility for these countries is to move towards commodity-based<br />
export-oriented industrialization (as in the case of Indonesia or Malaysia) or diversify<br />
within the primary sector itself (such as in Chile, Costa Rica or Colombia).<br />
Furthermore, in the nineteenth century, resource-rich countries such as the United States <strong>and</strong><br />
Australia, as well as the Sc<strong>and</strong>inavian countries, had achieved sustained growth <strong>and</strong> large increases<br />
in living st<strong>and</strong>ards as a result of their thriving agricultural, forest <strong>and</strong> mineral industries.<br />
Percentage<br />
decline in period<br />
141<br />
Total number of<br />
years of negative<br />
growth between<br />
1950 <strong>and</strong> 2001 a<br />
Africa<br />
Cameroon 1986-1994 1 695 978 42.3 11<br />
Côte d’Ivoire 1985-1994 1 798 1 214 32.5 23<br />
Democratic Republic of the Congo 1974-1983<br />
1986-2001<br />
842<br />
598<br />
587<br />
202<br />
30.2<br />
66.2<br />
32<br />
Djibouti 1984-1998 1 802 1 092 39.4 29<br />
Liberia 1979-1989 1 230 889 27.7 26<br />
Libyan Arab Jamahiriya 1979-1995 7 565 2 321 69.3 25<br />
Madagascar 1971-1978<br />
1979-1988<br />
1 246<br />
1 076<br />
1 007<br />
784<br />
19.2<br />
27.2<br />
26<br />
Namibia 1981-1988 4 159 3 478 16.4 14<br />
Sao Tome <strong>and</strong> Principe 1985-2000 1 486 1 226 17.5 25<br />
United Republic of Tanzania 1976-1985 620 519 16.3 24<br />
Ug<strong>and</strong>a<br />
Latin America <strong>and</strong> Caribbean<br />
1971-1980 871 577 33.7 21<br />
Bolivia 1978-1986 2 715 2 074 23.6 17<br />
Cuba 1957-1965 2 406 1 988 17.4 20<br />
Haiti 1980-1994 1 304 753 42.3 29<br />
Jamaica 1973-1980 4 130 3 121 24.4 17<br />
Nicaragua 1983-1993 2 169 1 308 39.7 22<br />
Venezuela<br />
Western Asia<br />
1977-1985 11 251 8 521 24.3 23<br />
Iraq 1979-1986 6 756 3 759 44.4 22<br />
Qatar 1980-1991 29 552 6 467 78.1 30<br />
Source: UN/DESA, based on Maddison (2001).<br />
a Meaning the total number of years in which income per head was less than in the previous year, which do not therefore represent a period of uninterrupted<br />
decline.