

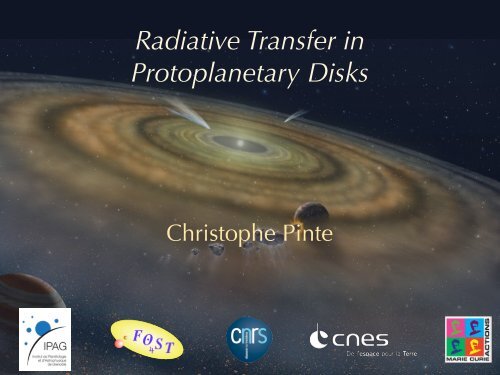
Radiative Transfer in Protoplanetary Disks
Radiative Transfer in Protoplanetary Disks
Radiative Transfer in Protoplanetary Disks

You also want an ePaper? Increase the reach of your titles
YUMPU automatically turns print PDFs into web optimized ePapers that Google loves.
<strong>Radiative</strong> <strong>Transfer</strong> <strong>in</strong><br />
<strong>Protoplanetary</strong> <strong>Disks</strong><br />
Christophe P<strong>in</strong>te
Outl<strong>in</strong>e<br />
•Context: Circumstellar <strong>Disks</strong> around Young Stars<br />
•Elements of cont<strong>in</strong>uum radiative transfer<br />
•Constra<strong>in</strong>ts from various techniques:<br />
- thermal emission & spectroscopy,<br />
- light scatter<strong>in</strong>g,<br />
- polarization,<br />
- <strong>in</strong>frared <strong>in</strong>terferometry<br />
•Multi-technique modell<strong>in</strong>g<br />
•Observation & modell<strong>in</strong>g of Gas <strong>in</strong> disks
Text<br />
From clouds<br />
to envelopes,<br />
to disks,<br />
to planets
- Timescale for gas dispersal<br />
and planet formation?<br />
- Gra<strong>in</strong> growth and settl<strong>in</strong>g ?<br />
- Relative evolution of dust<br />
and gas ?<br />
Text<br />
From clouds<br />
to envelopes,<br />
to disks,<br />
to planets<br />
?
Processes <strong>in</strong> <strong>Protoplanetary</strong> disks<br />
Processes <strong>in</strong> <strong>Protoplanetary</strong> <strong>Disks</strong><br />
© Peter Woitke
Dust <strong>in</strong> <strong>Protoplanetary</strong> disks<br />
•Dust gra<strong>in</strong>s are expected to grow by<br />
coagulation and to settle by gravity<br />
•<strong>Disks</strong> should have a stratified structure<br />
•Physical models predict extremely short<br />
timescales (
Why the need for Monte Carlo?<br />
• multiple-scatter<strong>in</strong>g<br />
• anisotropic scatter<strong>in</strong>g (+ polarisation)<br />
• complex 3D structure<br />
• benchmark: tested up to very high optical depths (106 42<br />
)<br />
• Fast: variance reduction techniques, MC + diffusion<br />
approx., MC + ray-trac<strong>in</strong>g<br />
Lefevre et al 1982, 1983<br />
Bjorkman & Wood, 2001<br />
Wolf, 2003<br />
Niccol<strong>in</strong>i, 2003<br />
Juvela, 2005<br />
P<strong>in</strong>te et al, 2006, 2009<br />
marche<br />
au hasard<br />
environnement<br />
circumstellaire<br />
x<br />
z<br />
étoile<br />
photon<br />
stellaire<br />
y<br />
photon thermique<br />
émis par le disque<br />
limite<br />
du modèle
© P. Woitke
Small gra<strong>in</strong>s<br />
IR spectroscopy with Spitzer<br />
Gra<strong>in</strong>s grow to μm sizes <strong>in</strong> the<br />
surface<br />
Evidence for gra<strong>in</strong> growth<br />
Gra<strong>in</strong>s grow to micron sizes …<br />
Large gra<strong>in</strong>s<br />
v. Boekel et al. 2003<br />
v. Boekel et al 2003
Tau<br />
First evidence of differential gra<strong>in</strong> growth ?<br />
β might be larger <strong>in</strong><br />
central parts of the disk<br />
→ ALMA<br />
See also Guilloteau et<br />
al 2010<br />
ISM dust<br />
0 30 40 50 60 70 80 90 100<br />
R (AU)<br />
!<br />
2.5<br />
2<br />
1.5<br />
1<br />
0.5<br />
DG Tau<br />
ISM dust<br />
0<br />
10 20 30 40 50 60 70 80 90 100<br />
R (AU)<br />
lope of the millimeter dust opacity β as a function of the radius for RY Tau (left panel) and<br />
t panel). Values of β outside the colored Isella regionet are al excluded 2010<br />
by our observations at more<br />
vel. The dashed l<strong>in</strong>es show the mean value of β derived <strong>in</strong> Paper I as discussed <strong>in</strong> Section 4.<br />
0<br />
2.5<br />
2<br />
1.5<br />
1<br />
0.5<br />
RY Tau<br />
I
Light scatter<strong>in</strong>g: anisotropy<br />
56 2.6.4 Quelques remarques sur la distribution angulaire de rayonnement<br />
Polarisability depends on gra<strong>in</strong> size<br />
S11<br />
S11<br />
0.012<br />
0.010<br />
0.008<br />
10 +0<br />
10 −2<br />
10 −4<br />
2πa<br />
λ 0.012<br />
=0.01 2πa<br />
λ =0.1<br />
0 90 180<br />
0.010<br />
0.008<br />
10 −2<br />
10 −4<br />
0 90 180<br />
1.5<br />
10 −2<br />
8.0<br />
6.0<br />
10 +0<br />
10 +0<br />
2πa<br />
λ = 10 2πa<br />
λ = 100 2πa<br />
λ<br />
angle de diffusion ( ◦ )<br />
angle de diffusion ( ◦ )<br />
10 −2<br />
2πa<br />
λ =1<br />
= 1000<br />
10<br />
0 90 180<br />
−4<br />
angle de diffusion ( ◦ )<br />
Figure 2.8 – Comparaison entre la fonction de phase calculée par la théorie de Mie (ligne ple<strong>in</strong>e)<br />
Mie theory gra<strong>in</strong> size distribution dn(a) α a et la fonction de Henyey-Greenste<strong>in</strong> (ligne en tirets) de même premier moment g = 〈cos θ〉<br />
-3.5 da
The case of GG Tau<br />
•A 0.13M, 180AU-radius circumb<strong>in</strong>ary r<strong>in</strong>g<br />
•Clear detection of the r<strong>in</strong>g <strong>in</strong> scattered light<br />
•Morphology extremely similar to visible<br />
image<br />
ISM dust models<br />
match the visible<br />
Image with i ! 40 o<br />
HST (0.8µm)<br />
Krist et al. (2002)<br />
Keck AO (3.8µm)<br />
Duchêne et al. (2004)<br />
1”
A first direct evidence<br />
Scattered light at Lʼ comes from 25AU above the<br />
midplane; I band, 50AU above<br />
•Arguably the most direct evidence of dust<br />
stratification to date<br />
Settl<strong>in</strong>g and/or growth?
atified model can reproduce all observations at once<br />
GG Tau: models with dust stratification<br />
ts<br />
Models with<br />
Observations Models without dust settl<strong>in</strong>g<br />
Observations Models without dust settl<strong>in</strong>g with dust dust settl<strong>in</strong>g<br />
> 5µm<br />
P<strong>in</strong>te et al. (2007)<br />
Christophe P<strong>in</strong>te An <strong>in</strong>-depth look at protoplanetary disks
G Tau : un anneau stratifié<br />
Tau : un anneau stratifié<br />
P<strong>in</strong>te et al, 2007,<br />
P<strong>in</strong>te et al, 2007, A&A<br />
G Tau : un anneau stratifié P<strong>in</strong>te et al, 2007, A&A<br />
GG Tau: a stratified r<strong>in</strong>g<br />
Images en lumière diffusée entre 0.5 et 3.8 µm<br />
mages en lumière diffusée entre 0.5 et 3.8 µm<br />
Images Stratification en lumière permet diffusée de entre les reproduire 0.5 et 3.8 µm simultanément<br />
Model with stratification reproduces images from 0.5 to 3.8μm<br />
Stratification permet de les reproduire simultanément<br />
Obs Models Modèles<br />
tratification permet de les reproduire simultanément<br />
Obs Modèles<br />
Obs Modèles<br />
paramétrique<br />
paramétrique<br />
paramétrique<br />
Lyon (Gonzalez) &<br />
Lyon Lyon (Gonzalez) (Gonzalez) & &<br />
Berne (Fouchet)<br />
Berne Berne (Fouchet) (Fouchet)<br />
hydro<br />
modélisation hydrodynamique<br />
hydr<br />
hydro<br />
modélisation modélisation hydrodynamique<br />
hydrodynamique<br />
+transfertradiatif<br />
+transfertradiatif<br />
+transfertradiatif<br />
SPH simulations (Fouchet, Gonzalez, Lyon) + radiative transfer<br />
P<strong>in</strong>te et al 2007<br />
Christophe P<strong>in</strong>te Formation et évolution des systèmes planétaires 8/14<br />
Christophe P<strong>in</strong>te Formation et évolution des systèmes planétaires<br />
Christophe P<strong>in</strong>te Formation et évolution des systèmes planétaires 8/1
Dust gra<strong>in</strong>s properties<br />
!"#$"%&'&()#$'%*+,()-,()."/%0(<br />
!"#$%&'%()%*)+,-).//0<br />
! !"#$%$&'(<br />
! ")*+,-#' ./ 0-.-123)4.<br />
HD 181327 (debris<br />
56477-#8-32#9)6:<br />
disk).<br />
The dust is more<br />
;-*##*4.3#<br />
generation)
Evidence of non spherical gra<strong>in</strong>s
S11 S11 S11 S11<br />
Signatures of agregates ?<br />
0 50 100 150<br />
sph1x.5x150#1(cmpt)<br />
sph1x.5x150#7(fl 100)<br />
sph1x.5x150 Average of #3,4,5<br />
0 50 100 150<br />
Angle de diffusion ( ◦ Angle de diffusion ( ) ◦ Angle de diffusion ( ) ◦ Angle de diffusion ( ) ◦ )<br />
Mie sphere
Polarisability of dust gra<strong>in</strong>s<br />
Unresolved polarisation Scatter<strong>in</strong>g & polarisation Dust properties<br />
Effect Polarisability of particle depends size : polarisability on gra<strong>in</strong> size<br />
Gra<strong>in</strong> size distribution: dn(a) ∝ a −3.5 da<br />
S12/S11<br />
S12/S11<br />
1.0<br />
0.5<br />
0.0<br />
1.0<br />
0.5<br />
0.0<br />
2πamax<br />
λ<br />
2πamax<br />
λ<br />
0 90 180<br />
angle<br />
= 0.1<br />
= 5<br />
1.0<br />
0.5<br />
0.0<br />
1.0<br />
0.5<br />
0.0<br />
2πamax<br />
λ<br />
2πamax<br />
λ<br />
0 90 180<br />
angle<br />
= 1<br />
= 10<br />
1.0<br />
0.5<br />
0.0<br />
1.0<br />
0.5<br />
0.0<br />
2πamax<br />
λ<br />
2πamax<br />
λ<br />
0 90 180<br />
angle<br />
= 2<br />
= 100<br />
Mie theory Marshall Perr<strong>in</strong> &gra<strong>in</strong> Christophesize P<strong>in</strong>te distribution Polarimetry of Circumstellar dn(a) <strong>Disks</strong> around α aYoung Stars 6/13 -3.5 da
Polarisability of dust gra<strong>in</strong>s<br />
Unresolved polarisation Scatter<strong>in</strong>g & polarisation Dust properties<br />
Effect Polarisability of particle depends size : polarisability on gra<strong>in</strong> size<br />
& composition/porosity (real part of refractive <strong>in</strong>dex)<br />
Gra<strong>in</strong> size distribution: dn(a) ∝ a−3.5 Gra<strong>in</strong> size distribution: dn(a) ∝ a da −3.5 da<br />
S12/S11<br />
S12/S11<br />
1.0<br />
0.5<br />
0.0<br />
1.0<br />
0.5<br />
0.0<br />
2πamax 2πamax 2πamax<br />
λ<br />
2πamax 2πamax 2πamax<br />
λ<br />
0 90 180 180<br />
angle<br />
= 0.1<br />
= 5<br />
1.0<br />
0.5<br />
0.0<br />
1.0<br />
0.5<br />
0.0<br />
2πamax 2πamax<br />
λ<br />
2πamax 2πamax 2πamax<br />
λ<br />
0 90 180<br />
angle<br />
= 1<br />
= 10<br />
1.0<br />
0.5<br />
0.0<br />
1.0<br />
0.5<br />
0.0<br />
2πamax 2πamax 2πamax<br />
λ<br />
2πamax 2πamax 2πamax<br />
λ<br />
0 90 180<br />
angle<br />
= 2<br />
= 100<br />
Mie theory gra<strong>in</strong> size distribution dn(a) α a -3.5 da<br />
Marshall Perr<strong>in</strong> & Christophe P<strong>in</strong>te Polarimetry of Circumstellar <strong>Disks</strong> around Young Stars 6/13
ect of chemical composition / porosity<br />
Effect of chemical composition/porosity<br />
Scatter<strong>in</strong>g phase function &<br />
atter<strong>in</strong>g phase function &<br />
polarisability both depend on<br />
larisability also depend on<br />
gra<strong>in</strong> composition & porosity<br />
a<strong>in</strong> composition & porosity<br />
Porous gra<strong>in</strong>s produce larger<br />
rous gra<strong>in</strong>s produce larger<br />
polarization for same<br />
larisation for same assymetry<br />
asymmetry parameter<br />
rameter g<br />
need to constra<strong>in</strong> g<br />
need to constra<strong>in</strong> g:<br />
Polarisability<br />
0.0<br />
→ multi-technique analysis<br />
lti-technique analyses 0.0 0.5 1.0<br />
1.0<br />
0.5<br />
Porous gra<strong>in</strong>s (Mathis & Whieffen)<br />
Compacts gra<strong>in</strong>s (Dra<strong>in</strong>e)<br />
g
Introduction Scatter<strong>in</strong>g & polarisation Unresolved polarisation Resolved polarimetry F<strong>in</strong>al remar<br />
Solution is not unique !!!<br />
GG Tau : models with stratification . . .<br />
Models with well-mixed<br />
A parametrized<br />
stratification of dust<br />
gra<strong>in</strong>s :<br />
dust population can also<br />
reproduce but this<br />
requires an “exotic” dust<br />
size distribution<br />
h0(a) = h0(am<strong>in</strong>)<br />
am<strong>in</strong><br />
a<br />
dn(a) α a -5.5 da<br />
A s<strong>in</strong>gle model reproduce<br />
all observations<br />
ξ<br />
ξ = 0.15 amax > 5 µm
odel<strong>in</strong>g of disks<br />
. polarisation can canhelp!!! help!!!<br />
... polarization can help !!!<br />
Gaspard Duchêne<br />
Us<strong>in</strong>g polarimetry to ref<strong>in</strong>e the model<br />
Us<strong>in</strong>g Us<strong>in</strong>gpolarimetry polarimetryto toref<strong>in</strong>e ref<strong>in</strong>e the the model model<br />
Observations With Withstratification stratification<br />
60%<br />
15%<br />
100<br />
50<br />
100<br />
100<br />
50<br />
65%<br />
15%<br />
Without Without stratification<br />
0<br />
0 0 50 100<br />
0 0<br />
50 100 0<br />
0 50 100 0 0<br />
50 100<br />
0 50 10<br />
Observations Warn<strong>in</strong>g Warn<strong>in</strong>g : noteModel : note the the different with strat<br />
different orientation! without strat<br />
orientation!<br />
Marshall<br />
Marshall<br />
Perr<strong>in</strong><br />
Perr<strong>in</strong><br />
& Christophe<br />
& Christophe<br />
P<strong>in</strong>te<br />
P<strong>in</strong>te<br />
Polarimetry<br />
Polarimetry<br />
of Circumstellar<br />
of Circumstellar<br />
<strong>Disks</strong><br />
<strong>Disks</strong><br />
around<br />
around<br />
Young<br />
Young<br />
Stars<br />
Stars<br />
12/14<br />
12/14<br />
100<br />
50<br />
100<br />
50<br />
80%<br />
10%
Another example: AU Mic<br />
HST 0.606 µm +pola<br />
10−10 e débris autour d’une d’uneM0 M0<br />
brillance<br />
re revers vers35 35AU AU<br />
ur r bleue bleue<br />
mple ple à àdeux deuxzones zones<br />
SED and images can be<br />
SED SED + profils profils<br />
la la and polarisation porous dust gra<strong>in</strong>s pour pour<br />
re e les les propriétés propriétésdes desgra<strong>in</strong>s gra<strong>in</strong>s<br />
reproduced both with compact<br />
Large polarisation → porous<br />
Schneider gra<strong>in</strong>s (ices) et et al, al, 2006 2006<br />
étude tude sur surHD HD181327 181327<br />
ation des disques protoplanétaires 37/39<br />
Fitzgerald et al 2007<br />
Gra<strong>in</strong>s Gra<strong>in</strong>s poreux, Mathis &<br />
Whieffen<br />
λFλ (W/m2 )<br />
λFλ (W/m2 )<br />
m − m∗ (mag/arcsec2 )<br />
m − m∗ (mag/arcsec2 )<br />
10 −10<br />
10−11 10−11 10−12 10−12 10−13 10−13 10−14 10−14 10−15 10−15 10−16 10−16 10−17 10−17 6<br />
6<br />
7<br />
7<br />
8<br />
8<br />
9<br />
9<br />
10<br />
10<br />
11<br />
11<br />
12<br />
12<br />
13<br />
13<br />
14<br />
14<br />
100 101 102 103 100 101 102 103 λ (µm)<br />
λ (µm)<br />
H<br />
H<br />
V (F606W)<br />
V (F606W)<br />
2MASS<br />
2MASS Spitzer<br />
Spitzer IRAS<br />
IRAS CSO<br />
CSO JCMT<br />
JCMT total<br />
total <strong>in</strong>ner<br />
<strong>in</strong>ner outer<br />
outer stellar<br />
stellar<br />
10 20 30 40 50 60 80 100<br />
10 20 30 40 50 60 80 100<br />
projected distance (AU)<br />
projected distance (AU)
Another example: AU Mic<br />
HST 0.606 µm +pola<br />
10−10 e débris autour d’une d’uneM0 M0<br />
brillance<br />
re revers vers35 35AU AU<br />
ur r bleue bleue<br />
mple ple à àdeux deuxzones zones<br />
SED and images can be<br />
SED ébris SED + autour profils profils d’une M0<br />
la la and polarisation porous dust gra<strong>in</strong>s pour pour<br />
illance<br />
re e les les propriétés propriétésdes desgra<strong>in</strong>s gra<strong>in</strong>s<br />
vers 35 AU<br />
reproduced both with compact<br />
Large polarisation → porous<br />
bleue<br />
Schneider gra<strong>in</strong>s (ices) et et al, al, 2006 2006<br />
étude tude sur surHD HD181327 181327<br />
le à deux zones<br />
ation des disques protoplanétaires 37/39<br />
Gra<strong>in</strong>s Gra<strong>in</strong>s poreux, Mathis &<br />
Whieffen<br />
λFλ (W/m2 )<br />
λFλ (W/m2 )<br />
m − m∗ (mag/arcsec2 )<br />
m − m∗ (mag/arcsec2 )<br />
10 −10<br />
10−11 10−11 10−12 10−12 10−13 10−13 10−14 10−14 10−15 10−15 10−16 10−16 10−17 10−17 0.456<br />
6<br />
0.407<br />
7<br />
0.35<br />
8<br />
8<br />
0.30<br />
9<br />
0.25 9<br />
10<br />
0.20 10<br />
11<br />
0.15 11<br />
12<br />
0.10 12<br />
0.05 13<br />
13<br />
0.00 14<br />
14<br />
100 101 102 103 10<br />
λ (µm)<br />
0 101 102 103 Gra<strong>in</strong>s poreux<br />
λ (µm)<br />
H<br />
H<br />
V (F606W)<br />
V (F606W)<br />
2MASS<br />
2MASS Spitzer<br />
Spitzer IRAS<br />
IRAS CSO<br />
CSO JCMT<br />
JCMT total<br />
total <strong>in</strong>ner<br />
<strong>in</strong>ner outer<br />
outer stellar<br />
stellar<br />
tion Études multi-tech. Sédimentation Na<strong>in</strong>es brunes et * Herbig Disques évolués Concl<br />
le : AU Mic<br />
Fitzgerald et al 2007<br />
Q 2 + U 2 /I<br />
model<br />
NW<br />
SE<br />
Porous gra<strong>in</strong>s<br />
20 10 30 40 20 50 30 60 40 70 50 60 80 80 100 90<br />
10 20 30 40 50 60 80 100<br />
projected distance (AU)<br />
projected distance (AU)
Another example: AU Mic<br />
HST 0.606 µm +pola<br />
10−10 e débris autour d’une d’uneM0 M0<br />
brillance<br />
re revers vers35 35AU AU<br />
ur r bleue bleue<br />
mple ple à àdeux deuxzones zones<br />
SED and images can be<br />
SED ébris SED + autour profils profils d’une M0<br />
la la and polarisation porous dust gra<strong>in</strong>s pour pour<br />
illance<br />
re e les les propriétés propriétésdes desgra<strong>in</strong>s gra<strong>in</strong>s<br />
vers 35 AU<br />
reproduced both with compact<br />
Large polarisation → porous<br />
bleue<br />
Schneider gra<strong>in</strong>s (ices) et et al, al, 2006 2006<br />
étude tude sur surHD HD181327 181327<br />
le à deux zones<br />
ation des disques protoplanétaires 37/39<br />
Gra<strong>in</strong>s Gra<strong>in</strong>s poreux, Mathis &<br />
Whieffen<br />
λFλ (W/m2 )<br />
λFλ (W/m2 )<br />
m − m∗ (mag/arcsec2 )<br />
m − m∗ (mag/arcsec2 )<br />
10 −10<br />
10−11 10−11 10−12 10−12 10−13 10−13 10−14 10−14 10−15 10−15 10−16 10−16 10−17 10−17 0.456<br />
6<br />
0.407<br />
7<br />
0.35<br />
8<br />
8<br />
0.30<br />
9<br />
0.25 9<br />
10<br />
0.20 10<br />
11<br />
0.15 11<br />
12<br />
0.10 12<br />
0.05 13<br />
13<br />
0.00 14<br />
14<br />
100 101 102 103 10<br />
λ (µm)<br />
0 101 102 103 Gra<strong>in</strong>s poreux<br />
λ (µm)<br />
H<br />
H<br />
V (F606W)<br />
V (F606W)<br />
2MASS<br />
2MASS Spitzer<br />
Spitzer IRAS<br />
IRAS CSO<br />
CSO JCMT<br />
JCMT total<br />
total <strong>in</strong>ner<br />
<strong>in</strong>ner outer<br />
outer stellar<br />
stellar<br />
tion Études multi-tech. Sédimentation Na<strong>in</strong>es brunes et * Herbig Disques évolués Concl<br />
le : AU Mic<br />
Fitzgerald et al 2007<br />
Q 2 + U 2 /I<br />
model<br />
NW<br />
SE<br />
Porous gra<strong>in</strong>s<br />
Compact gra<strong>in</strong>s<br />
20 10 30 40 20 50 30 60 40 70 50 60 80 80 100 90<br />
10 20 30 40 50 60 80 100<br />
projected distance (AU)<br />
projected distance (AU)
Unresolved polarimetry: tomography of <strong>in</strong>ner<br />
The magnetospheric<br />
accretion predicts<br />
formation of warp at<br />
the <strong>in</strong>ner edge<br />
disk<br />
Tool to probe the disk-star <strong>in</strong>terface<br />
No. 2, 2004<br />
of TeA is important for understand<strong>in</strong>g the variability <strong>in</strong> different<br />
spectral bands. The spots are expected to be smaller at<br />
higher TeA and larger at lower TeA. An <strong>in</strong>dication of such a<br />
distribution may have been observed <strong>in</strong> the CTTS object BP<br />
Tauri, where the estimated area of the hot spots was different<br />
when different methods were used. Errico et al. (2001) esti-<br />
mated the area to be 20% of the surface of the star. They used<br />
spectral l<strong>in</strong>es that are thought to orig<strong>in</strong>ate <strong>in</strong> the external<br />
regions of the funnel flow. Ardila & Basri (2000) estimated the<br />
area to be much smaller, 0.3%. However, they modeled the UV<br />
cont<strong>in</strong>uum, which orig<strong>in</strong>ates <strong>in</strong> the hottest region of the spots.<br />
DISK ACCRETION TO INCLINED DIPOLE. II. 925<br />
Fig. 4.—X -Z slice through the middle of the funnel stream at ¼ 15 . The contour l<strong>in</strong>es show the plane cross section of the density distribution <strong>in</strong>side the funnel<br />
stream. The density changes exponentially from ¼ 0:2 (blue) to ¼ 2:0 (red). The density <strong>in</strong> the corona above the disk is ¼ 0:01 0:02. Red l<strong>in</strong>es with arrows<br />
show selected magnetic field l<strong>in</strong>es. The magnetic moment, m, and the rotation axis, 6, are shown.<br />
≈ 0.025 AU<br />
4. INTENSITY OF RADIATION AND LIGHT CURVES<br />
To calculate the radiation <strong>in</strong>tensity from the hot spots,<br />
we suppose that all the k<strong>in</strong>etic energy flux Fe(R) goes<br />
<strong>in</strong>to radiation. The energy radiated from a unit area of the<br />
spot is<br />
Figure from Romanova et al 2004<br />
Z<br />
Fe(R) ¼<br />
cos >0<br />
d f (R; m); ð5Þ<br />
where f (R; m) is the <strong>in</strong>tensity of the radiation from a unit area
i<br />
mary:<br />
Tomography of the <strong>in</strong>ner disk<br />
variable achromatic<br />
ction<br />
ltation by a<br />
prehensive monitor<strong>in</strong>g<br />
ormed” AA Taudisk<br />
y rotation periods<br />
Interaction with<br />
magnetosphere<br />
mary:<br />
See Terquem &<br />
Quick summary:<br />
Papaloizou 2000<br />
variable achromatic<br />
ction<br />
ltation by a<br />
ormed” disk<br />
synoptic monitor<strong>in</strong>g<br />
Many rotation periods<br />
Need variable achromatic<br />
ext<strong>in</strong>ction → occultation<br />
Interaction with<br />
magnetosphere<br />
Wood et al 1996<br />
Ménard et al 2003<br />
O’Sullivan et al 2005<br />
Bouvier et al, 1999<br />
Marshall Perr<strong>in</strong> & Christophe P<strong>in</strong>te Polarimetry of Circumstellar <strong>Disks</strong> around Young Stars 2/1<br />
by a “deformed” disk
i<br />
mary:<br />
Tomography of the <strong>in</strong>ner disk<br />
variable achromatic<br />
ction<br />
ltation by a<br />
prehensive monitor<strong>in</strong>g<br />
ormed” AA Taudisk<br />
y rotation periods<br />
Interaction with<br />
magnetosphere<br />
mary:<br />
See Terquem &<br />
Quick summary:<br />
Papaloizou 2000<br />
variable achromatic<br />
ction<br />
ltation by a<br />
ormed” disk<br />
synoptic monitor<strong>in</strong>g<br />
Many rotation periods<br />
Need variable achromatic<br />
ext<strong>in</strong>ction → occultation<br />
Interaction with<br />
magnetosphere<br />
Unresolved polarisation Scatter<strong>in</strong>g & polarisation D<br />
Inner region model<br />
Bouvier et al, 1999<br />
Marshall Perr<strong>in</strong> & Christophe P<strong>in</strong>te Polarimetry of Circumstellar <strong>Disks</strong> around Young Stars 2/1<br />
by a “deformed” disk<br />
2%<br />
Pola<br />
Photo-polarimetric variation 0%<br />
Wood et al 1996<br />
Ménard et al 2003<br />
O’Sullivan et al 2005
ng the <strong>in</strong>ner radius of circumstellar disks<br />
Measur<strong>in</strong>g the <strong>in</strong>ner radius of disks<br />
teristic NIR size measured by <strong>in</strong>terferometers<br />
Characteristic NIR size measured by <strong>in</strong>terferometers < 1 AU:<br />
:comparabletothelocationofterrestrialplanets<strong>in</strong><br />
comparable to the location of terrestrial planets <strong>in</strong> more<br />
volved systems<br />
odel<br />
evolved systems<br />
ple emission model :<br />
R<strong>in</strong>g model:<br />
resolved central star + narrow<br />
g<br />
simple emission model:<br />
unresolved central star + narrow<br />
ative contribution from the<br />
r<strong>in</strong>g<br />
r and the disk estimated from<br />
relative contribution from star &<br />
uxdecompositionofthe<br />
disk estimated from SED<br />
ad-band SED (Millan-Gabet<br />
01)
R<strong>in</strong>g Radius (AU)<br />
100.00<br />
10.00<br />
1.00<br />
0.10<br />
0.01<br />
Inner radius ot T Tauri stars<br />
Radii <strong>in</strong>ferred from <strong>in</strong>terferometry larger than predicted<br />
HAe Objects<br />
HBe Objects<br />
TTS Objects<br />
Sublimation radius: direct dust heat<strong>in</strong>g, backwarm<strong>in</strong>g<br />
Sublimation radius: direct dust heat<strong>in</strong>g, no backwarm<strong>in</strong>g<br />
Sublimation radius: standard model<br />
10 0<br />
10 0<br />
10 0<br />
Herbig Ae<br />
10 2<br />
10 2<br />
10 2<br />
Lstar + Laccretion (Lsolar)<br />
10 4<br />
10 4<br />
10 4<br />
1000K 1000K 1000K<br />
1000K 1000K<br />
1500K 1500K 1500K<br />
1500K 1500K 1500K<br />
1000K 1000K 1000K<br />
1500K 1500K 1500K<br />
10 6<br />
10 6<br />
10 6<br />
Direct heat<strong>in</strong>g of <strong>in</strong>ner dust disk<br />
Star<br />
(magnetospheric<br />
accretion?)<br />
optically!th<strong>in</strong> gas<br />
(puffed!up<br />
<strong>in</strong>ner wall?)<br />
Dust Sublimation<br />
Radius R s<br />
"Standard" Disk Model ! oblique disk heat<strong>in</strong>g<br />
Star<br />
(magnetospheric<br />
accretion?)<br />
optically!thick<br />
gas<br />
Dust Sublimation<br />
Radius R s<br />
Fig. 2.— Measured sizes of HAeBe and T Tauri objects vs. central lum<strong>in</strong>osity (stellar + accretion shock); and com<br />
sublimation Millan-Gabet radii for dust directly et heated heatedal by by2006 the central lum<strong>in</strong>osity (solid and dashed l<strong>in</strong>es) and for the oblique heat<strong>in</strong>g i<br />
classical models (dotted l<strong>in</strong>e). A schematic representation ofthekeyfeaturesof<strong>in</strong>nerdiskstructure<strong>in</strong>thesetwoclasses<br />
f<br />
flared flared flared disk disk disk
R<strong>in</strong>g Radius (AU)<br />
100.00<br />
10.00<br />
1.00<br />
0.10<br />
0.01<br />
Inner radius ot T Tauri stars<br />
Radii <strong>in</strong>ferred from <strong>in</strong>terferometry larger than predicted<br />
HAe Objects<br />
HBe Objects<br />
TTS Objects<br />
Sublimation radius: direct dust heat<strong>in</strong>g, backwarm<strong>in</strong>g<br />
Sublimation radius: direct dust heat<strong>in</strong>g, no backwarm<strong>in</strong>g<br />
Sublimation radius: standard model<br />
10 0<br />
10 0<br />
10 0<br />
Sublimation radius<br />
Herbig Ae<br />
10 2<br />
10 2<br />
10 2<br />
Lstar + Laccretion (Lsolar)<br />
10 4<br />
10 4<br />
10 4<br />
1000K 1000K 1000K<br />
1000K 1000K<br />
1500K 1500K 1500K<br />
1500K 1500K 1500K<br />
1000K 1000K 1000K<br />
1500K 1500K 1500K<br />
10 6<br />
10 6<br />
10 6<br />
Direct heat<strong>in</strong>g of <strong>in</strong>ner dust disk<br />
Star<br />
(magnetospheric<br />
accretion?)<br />
optically!th<strong>in</strong> gas<br />
(puffed!up<br />
<strong>in</strong>ner wall?)<br />
Dust Sublimation<br />
Radius R s<br />
"Standard" Disk Model ! oblique disk heat<strong>in</strong>g<br />
Star<br />
(magnetospheric<br />
accretion?)<br />
optically!thick<br />
gas<br />
Dust Sublimation<br />
Radius R s<br />
Fig. 2.— Measured sizes of HAeBe and T Tauri objects vs. central lum<strong>in</strong>osity (stellar + accretion shock); and com<br />
sublimation Millan-Gabet radii for dust directly et heated heatedal by by2006 the central lum<strong>in</strong>osity (solid and dashed l<strong>in</strong>es) and for the oblique heat<strong>in</strong>g i<br />
classical models (dotted l<strong>in</strong>e). A schematic representation ofthekeyfeaturesof<strong>in</strong>nerdiskstructure<strong>in</strong>thesetwoclasses<br />
f<br />
flared flared flared disk disk disk
R<strong>in</strong>g Radius (AU)<br />
100.00<br />
10.00<br />
1.00<br />
0.10<br />
0.01<br />
Inner radius ot T Tauri stars<br />
Radii <strong>in</strong>ferred from <strong>in</strong>terferometry larger than predicted<br />
HAe Objects<br />
HBe Objects<br />
TTS Objects<br />
Sublimation radius: direct dust heat<strong>in</strong>g, backwarm<strong>in</strong>g<br />
Sublimation radius: direct dust heat<strong>in</strong>g, no backwarm<strong>in</strong>g<br />
Sublimation radius: standard model<br />
CTTS<br />
10 0<br />
10 0<br />
10 0<br />
Sublimation radius<br />
Herbig Ae<br />
10 2<br />
10 2<br />
10 2<br />
Lstar + Laccretion (Lsolar)<br />
10 4<br />
10 4<br />
10 4<br />
1000K 1000K 1000K<br />
1000K 1000K<br />
1500K 1500K 1500K<br />
1500K 1500K 1500K<br />
1000K 1000K 1000K<br />
1500K 1500K 1500K<br />
10 6<br />
10 6<br />
10 6<br />
Star<br />
accretional<br />
Direct heat<strong>in</strong>g of <strong>in</strong>ner dust disk<br />
heat<strong>in</strong>g? lower<br />
sublimation<br />
optically!th<strong>in</strong> gas<br />
temperature?<br />
(magnetospheric<br />
accretion?)<br />
smaller dust<br />
gra<strong>in</strong>s?<br />
photoevaporation?<br />
optically!thick<br />
gas<br />
magnetospheric<br />
Dust Sublimation<br />
truncation?<br />
(puffed!up<br />
<strong>in</strong>ner wall?)<br />
Dust Sublimation<br />
Radius R s<br />
"Standard" Disk Model ! oblique disk heat<strong>in</strong>g<br />
Star<br />
(magnetospheric<br />
accretion?)<br />
Radius R s<br />
scattered light?<br />
Fig. 2.— Measured sizes of HAeBe and T Tauri objects vs. central lum<strong>in</strong>osity (stellar + accretion shock); and com<br />
sublimation Millan-Gabet radii for dust directly et heated heatedal by by2006 the central lum<strong>in</strong>osity (solid and dashed l<strong>in</strong>es) and for the oblique heat<strong>in</strong>g i<br />
classical models (dotted l<strong>in</strong>e). A schematic representation ofthekeyfeaturesof<strong>in</strong>nerdiskstructure<strong>in</strong>thesetwoclasses<br />
f<br />
flared flared flared disk disk disk
!.F! (W.m )<br />
hy should should we we care care about about scattered light light ? ?<br />
Why should we care about scattered light?<br />
ak Peak of the of the photosphere mov<strong>in</strong>g mov<strong>in</strong>g towards towards longer longer λ λ<br />
Peak of the photosphere mov<strong>in</strong>g towards longer λ<br />
action Fraction of stellar of stellar (and (and then then also also scattered) light light is larger is larger<br />
Fraction of stellar (and then also scattered) light is larger<br />
bedo Albedo can can be large be large <strong>in</strong> the <strong>in</strong> the NIR NIR ! !<br />
10 −12<br />
10 −14<br />
10 −16<br />
Albedo can be large <strong>in</strong> the NIR ! between 0.4 and 0.9 at 2.2<br />
albedo albedo between between 0.4 0.4 and and 0.9 0.9 at 2.2 at 2.2 µm, µm, depend<strong>in</strong>gon<br />
μm, depend<strong>in</strong>g on gra<strong>in</strong> sizes and dust composition<br />
gra<strong>in</strong> gra<strong>in</strong> sizes sizes and and dust dust composition<br />
!.F! (W.m −2 )<br />
10 −12<br />
10 −14<br />
10 −16<br />
Herbig Herbig Ae star Ae star<br />
0.1 0.1 1.0 1.010.0 10.0 100.0 100.0 1000. 1000.<br />
! (µm) ! (µm)<br />
!.F! (W.m −2 )<br />
10 −12<br />
10 −14<br />
10 −16<br />
!.F! (W.m −2 )<br />
10 −12<br />
10 −14<br />
10 −16<br />
TTauristar<br />
0.1 0.1 1.0 1.010.0 10.0100.0 100.0 1000. 1000.<br />
! (µm) ! (µm)
But models were neglect<strong>in</strong>g<br />
scattered light, which is the<br />
dom<strong>in</strong>ant contribution<br />
→ over-estimation by factor 2<br />
Inner radius of T Tauri stars<br />
Inner radius measured by IR <strong>in</strong>terferometry apparently larger<br />
than sublimation radius for T Tauri stars<br />
Need for detailed RT codes like<br />
MCFOST<br />
Interpretation of AMBER data:<br />
Tatulli et al 2008<br />
Benisty et al 2010<br />
Olofsson et al 2010<br />
Tatulli et al 2010<br />
1 AU<br />
Total Thermal emission<br />
Scattered light Scat. thermal em.<br />
FOV VLTI<br />
P<strong>in</strong>te et al 2008
Introduction MCFOST IM Lup GG Tau IRAS 04158 Inner dust disk Summary<br />
Introduction MCFOST IM Lup GG Tau IRAS 04158 Inner dust disk Summary<br />
What radius would have been measured ?<br />
What What radius radius would would<br />
What radius would have have have<br />
been been been<br />
measured measured<br />
?<br />
?<br />
Synthetic Disk model image<br />
Synthetic image<br />
Fitted r<strong>in</strong>g<br />
Fitted r<strong>in</strong>g<br />
Fitted r<strong>in</strong>g<br />
Scattered light can be a sufficient explanation<br />
Scattered light can be a sufficient explanation<br />
Scattered The location light can of fitted be a<strong>in</strong>ner sufficient radii explanation mimics very<br />
The location of fitted <strong>in</strong>ner radii mimics very<br />
The well location the distribution of fitted <strong>in</strong>ner of data radii po<strong>in</strong>ts mimics very<br />
d=140 pc, B = 80 mwell<br />
the distribution of data po<strong>in</strong>ts<br />
d=140 pc, B = 80 m well the distribution of data po<strong>in</strong>ts<br />
d=140 pc, B = 80 m<br />
Teff =4000K,<br />
Teff =4000K,<br />
Teff =4000K,<br />
R<strong>in</strong> R<strong>in</strong> (AU) (AU)<br />
R<strong>in</strong> (AU)<br />
0.5<br />
0.5<br />
0.5<br />
0.2<br />
0.2<br />
0.2<br />
0.1<br />
0.1<br />
0.1<br />
0.05<br />
0.05<br />
0.05<br />
0.02<br />
0.02<br />
0.02<br />
1.0 10.0<br />
1.0 L (Lsun) 10.0<br />
1.0 L (Lsun) 10.0<br />
L (Lsun)<br />
Scattered light is a sufficient explanation<br />
The location of fitted <strong>in</strong>ner radii mimics very<br />
Christophe P<strong>in</strong>te An <strong>in</strong>-depth look at protoplanetary disks 29/31<br />
Christophe P<strong>in</strong>te An <strong>in</strong>-depth look at protoplanetary disks 29/31<br />
Christophe P<strong>in</strong>te An <strong>in</strong>-depth look at protoplanetary disks 29/31<br />
well the distribution of data po<strong>in</strong>ts
Introduction Activités Activités de de recherche recherche Projet Projet de de recherche recherche Résumé Résumé<br />
Un Un exemple exemple : IM : IMLup, Lup, une une CTTS CTTStypique typique<br />
Multi-λ modell<strong>in</strong>g of IM Lupi<br />
Modélisation du dudisque disque d’IM Lup P<strong>in</strong>te et etal, al, 2008b, A&A<br />
!.F! (W.m−2 !.F! (W.m<br />
)<br />
−2 )<br />
A s<strong>in</strong>gle model with mild stratification remarkably reproduces<br />
all Un Un observations: unique modèle H(1mm) avec une une ≈ 0.5 faible H(1μm) stratification<br />
reproduit remarquablement bien l’ensemble des données<br />
WFPC2 bien l’ensemble 0.6 μm des données<br />
1’’<br />
E<br />
N<br />
1.0<br />
WFPC2 0.6 0.6 µm µm<br />
SMA SMA1.3 1.3mm mm<br />
10−12 10−12 10−14 10−14 2<br />
2<br />
10−16 10−13 10−16 10−13 5.<br />
5.<br />
10.0<br />
10.0<br />
20.<br />
20.<br />
1.0<br />
1.0<br />
10.0<br />
10.0<br />
100.0<br />
100.0<br />
1000.<br />
1000.<br />
! (µm) ! (µm)<br />
⇓⇓<br />
Mdisque, croissanceet<br />
Mdust,<br />
croissanceet<br />
gra<strong>in</strong> growth<br />
sédimentation<br />
& settl<strong>in</strong>g<br />
➜<br />
10 C. P<strong>in</strong>te et al.: Prob<strong>in</strong>g dust gra<strong>in</strong> evolution <strong>in</strong> IM<br />
1’’<br />
1’’<br />
E<br />
E<br />
N<br />
Nicmos<br />
Nicmos 1.6<br />
1.6<br />
Nicmos 1.6 µm µm<br />
μm<br />
Obs Modèles<br />
Model<br />
⇓<br />
F" (Jy)<br />
F" (Jy)<br />
F" (Jy)<br />
F" (Jy)<br />
0.2<br />
0.2<br />
0.1<br />
0.1<br />
0.05<br />
0.05<br />
0.02<br />
0.02<br />
0.01<br />
0.01<br />
0.005<br />
0.005<br />
p=0 p=0 p=1 p=1<br />
ATCA 3.3 3.3 mm mm<br />
p=2 p=2<br />
p=0 p=0<br />
0 50 100<br />
0 50 100<br />
Basel<strong>in</strong>e<br />
Basel<strong>in</strong>e<br />
(k!)<br />
(k!)<br />
p=2 p=2<br />
p=1 p=1<br />
⇓<br />
Densité de surface<br />
Σ(r) ∝ r −p<br />
⇓<br />
Densité de surface<br />
Σ(r) ∝ r −p<br />
Surface density<br />
Σ(r) α r-p Coll. Coll. Grenoble (Ménard, Augereau, Duchêne), JPL/Caltech (Padgett,Stapelfeldt),<br />
P<strong>in</strong>te et al 2008<br />
Arizona (Schneider), Leiden Leiden (Panić, van vanDishoeck), Dishoeck), Spitzer Legacy Team Teamc2d c2d<br />
N<br />
Brightness profile<br />
0.5<br />
0.0<br />
0 90 180 270<br />
Azimuthal angle ( o )<br />
Fig. 8. Scattered light images of the best models compared to observations. L<br />
at 0.606 µm andthelowerrowtothoseat1.6µm. Synthetic maps (right) w<br />
from theRext, peak). Rext, Central i, i, H0<br />
H0panel:<br />
0.6 µm azimuthalbrightnessprofile.Right<br />
central Rout, and right i, Ho, panels, gra<strong>in</strong> the red dashed l<strong>in</strong>e correspond to the best fit of the<br />
of all observations simultaneously and the blue dotted to the scatteredlight<br />
<strong>in</strong> the front side of the disc, i.e. towards bottom <strong>in</strong> the first panel.<br />
➜<br />
size, composition<br />
➜
≈ 400 000 models<br />
Some parameters<br />
fixed from data<br />
(amax, Mdust, Rout)<br />
→Fitt<strong>in</strong>g for 6<br />
parameters<br />
IM Lupi: quantitative constra<strong>in</strong>ts<br />
Bayesian method to estimate model parameters:<br />
for SED<br />
P<strong>in</strong>te et al 2008<br />
Probability<br />
Probability Probability Probability Probability Probability<br />
1.0<br />
0.5<br />
0.0<br />
1.0<br />
0.6<br />
0.4<br />
0.2<br />
0.5<br />
cos(i)<br />
0.0<br />
0.05 0.1 0.2 0.5 1.0<br />
r<strong>in</strong><br />
1.0<br />
0.5<br />
0.0<br />
0.0<br />
1.0<br />
0.5<br />
0.0<br />
0<br />
−1<br />
−2<br />
5 10 15<br />
1.0<br />
0.5<br />
0.0<br />
0.6<br />
0.4<br />
0.2<br />
1.0 1.1 1.2<br />
surface density flar<strong>in</strong>g<br />
0.0<br />
0.00 0.05 0.10 0.15 0.20<br />
H stratification<br />
See also Glauser et al 2008, Bouy et al 2008, Duchêne et al 2010
≈ 400 000 models<br />
Some parameters<br />
fixed from data<br />
(amax, Mdust, Rout)<br />
→Fitt<strong>in</strong>g for 6<br />
parameters<br />
IM Lupi: quantitative constra<strong>in</strong>ts<br />
Bayesian method to estimate model parameters:<br />
for SED + mm visibilities<br />
P<strong>in</strong>te et al 2008<br />
Probability<br />
Probability Probability Probability Probability Probability<br />
1.0<br />
0.5<br />
0.0<br />
1.0<br />
0.6<br />
0.4<br />
0.2<br />
0.5<br />
cos(i)<br />
0.0<br />
0.05 0.1 0.2 0.5 1.0<br />
r<strong>in</strong><br />
1.0<br />
0.5<br />
0.0<br />
0.0<br />
1.0<br />
0.5<br />
0.0<br />
0<br />
−1<br />
−2<br />
5 10 15<br />
1.0<br />
0.5<br />
0.0<br />
0.6<br />
0.4<br />
0.2<br />
1.0 1.1 1.2<br />
surface density flar<strong>in</strong>g<br />
0.0<br />
0.00 0.05 0.10 0.15 0.20<br />
H stratification<br />
See also Glauser et al 2008, Bouy et al 2008, Duchêne et al 2010
≈ 400 000 models<br />
Some parameters<br />
fixed from data<br />
(amax, Mdust, Rout)<br />
→Fitt<strong>in</strong>g for 6<br />
parameters<br />
IM Lupi: quantitative constra<strong>in</strong>ts<br />
Bayesian method to estimate model parameters:<br />
for SED + mm visibilities + scattered light images<br />
P<strong>in</strong>te et al 2008<br />
Probability<br />
Probability Probability Probability Probability Probability<br />
1.0<br />
0.5<br />
0.0<br />
1.0<br />
0.6<br />
0.4<br />
0.2<br />
0.5<br />
cos(i)<br />
0.0<br />
0.05 0.1 0.2 0.5 1.0<br />
r<strong>in</strong><br />
1.0<br />
0.5<br />
0.0<br />
0.0<br />
1.0<br />
0.5<br />
0.0<br />
0<br />
−1<br />
−2<br />
5 10 15<br />
1.0<br />
0.5<br />
0.0<br />
0.6<br />
0.4<br />
0.2<br />
1.0 1.1 1.2<br />
surface density flar<strong>in</strong>g<br />
0.0<br />
0.00 0.05 0.10 0.15 0.20<br />
H stratification<br />
See also Glauser et al 2008, Bouy et al 2008, Duchêne et al 2010
• Gas represents 99% of<br />
the disk mass<br />
• Difficult to observe but<br />
Herschel is open<strong>in</strong>g the<br />
far-IR w<strong>in</strong>dow<br />
• Gas & dust evolution<br />
strongly coupled<br />
Gas and Dust Evolution<br />
Gas & Dust evolution<br />
VIMOS Multi-object Spectroscopy and Spitzer/IRA<br />
Fedele et al. 2009<br />
Fedele et al. (2009, Poster A 31)
IR excesses, we can measure a truly <strong>in</strong>dependent gas depletion timescale and exam<strong>in</strong>e the possibility of gas rich,<br />
dust poor systems. These objects are (<strong>in</strong>itially) only observed <strong>in</strong> [CII]158µm and [OI]63µm and account for<br />
Gas <strong>in</strong> <strong>Protoplanetary</strong> Systems<br />
14% of the Phase I time. A significant fraction of the targets are multiple stars (25%, separations 5-1000 AU),<br />
enabl<strong>in</strong>g the survey to be used to study the effect of companions on gas disks. These have not been excluded<br />
to avoid selection bias. F<strong>in</strong>ally the target list has a wide range of X-ray lum<strong>in</strong>osity (10 28 − 10 31 erg s −1 ) and<br />
Hα l<strong>in</strong>e strength (W (Hα) =1− 150 ˚A). This allows multivariate analysis of l<strong>in</strong>e strengths and ratios, which<br />
is only possible with such a large and unbiased sample, and <strong>in</strong>creases the legacy value. An estimate of the<br />
Statistical survey (≈ 250 disks) : evolution of gas<br />
required number of targets is given by the number of b<strong>in</strong>s of primary parameters (mass, spectral type and age):<br />
Ntargets = Nmass.Nsp.t.Nage.N, whereN is the number <strong>in</strong> each b<strong>in</strong>. To <strong>in</strong>vestigate effects of other parameters<br />
and dust from young gas-rich protoplanetary disks,<br />
and give a statistically-robust result, we have set Nb = 10. A m<strong>in</strong>imum of 3 logarithmically-spaced b<strong>in</strong>s of<br />
each parameter means we need ∼270 targets. Figure 4 shows the distribution over the primary parameters, and<br />
Table 4 summarises the sample clusters.<br />
to old “dry” debris disks:<br />
Table 4. Target clusters<br />
•Ages 1 – 30Myr, M to A stars, disk dust mass (10-2 - 10-5 Distance Age Total Number Mo)<br />
Group (pc) (Myr) number Phase I<br />
Taurus 140 0.3 − 4 109 48<br />
Upper Sco 145 5 48 2<br />
η Cha 112 5 − 9 17 1<br />
TW Hya 50 8 − 10 13 0<br />
β Pic 30 10 − 20 19 0<br />
Tuc Hor 46 30 18 0<br />
Ae/Be stars 50 − 200 0.5 − 30 50 26<br />
•Well-known star-form<strong>in</strong>g regions (Taurus, TW Hydra, η Cha,<br />
β Pic, Tuc Hor, Upper Sco, Herbig Ae/Be)<br />
•Key far-IR tracers: [OI], [CII], H2O, CO + Phot. at 70 & 160μm
Modell<strong>in</strong>g tools: MCFOST + ProDiMo<br />
Interpretation of l<strong>in</strong>e observations is complex !<br />
→ need for detailed modell<strong>in</strong>g.<br />
MCFOST: 3D cont<strong>in</strong>uum & l<strong>in</strong>e radiative transfer (P<strong>in</strong>te et al<br />
2006, 2009)<br />
+ ProDiMo: thermal balance & chemistry (Woitke et 2009,<br />
Kamp et al 2010)
Modell<strong>in</strong>g tools: the DENT grid<br />
Grid of ≈ 300 000 disk<br />
models:<br />
•sample the disk parameters<br />
observed by GASPS<br />
•thermo-chemical structure:<br />
Tdust, Tgas, abundances<br />
•SEDs<br />
•29 l<strong>in</strong>e fluxes and profiles:<br />
[OI], [CII], 12 CO, o-H2O,<br />
p-H2O<br />
→ Statistical tool<br />
78.74 423 423 423 → 312 312 312 0.484 LAMBDA<br />
p-H2O 303.46<br />
269.27<br />
144.52<br />
138.53<br />
100.98<br />
89.99<br />
202 202 202 → 111 111 111<br />
111 111 111 → 000 000 000<br />
413 413 413 → 322 322 322<br />
313 313 313 → 202 202 202<br />
220 220 220 → 111 111 111<br />
322 322 322 → 211 211 211<br />
0.0058<br />
0.0184<br />
0.0332<br />
0.125<br />
0.260<br />
0.352<br />
LAMBDA<br />
LAMBDA<br />
LAMBDA<br />
LAMBDA<br />
LAMBDA<br />
LAMBDA<br />
Table 2. Parameters for the model grid and values assumed. Constant<br />
scale height H0 H0 H0 = 10 AU is assumed at r0 r0 r0 = 100 AU and a constant<br />
maximum gra<strong>in</strong> Ménard size of et amax amax amax =1mm. al, <strong>in</strong> prep.<br />
stellar parameter<br />
Woitke et al 2010<br />
Kamp et al, <strong>in</strong> prep.<br />
M⋆ M⋆ M⋆<br />
age<br />
stellar mass [M⊙]<br />
age [Myr]<br />
0.5, 1.0, 1.5, 2.0,2.5<br />
1, 3, 10, 100<br />
fUV fUV fUV excess UV fUV fUV fUV = LUV/L⋆ LUV/L⋆ LUV/L⋆ 0.001, 0.1<br />
disc parameter<br />
Md disc dust mass [M⊙] 10−7 ,10−6 ,10−5 ,10−4 ,10−3 Md disc dust mass [M⊙] 10−7 ,10−6 ,10−5 ,10−4 ,10−3 Md disc dust mass [M⊙] 10−7 ,10−6 ,10−5 ,10−4 ,10−3 δ = ρd/ρg ρd/ρg ρd/ρg dust/gas mass ratio 0.001, 0.01, 0.1, 1, 10<br />
R<strong>in</strong> R<strong>in</strong> R<strong>in</strong> <strong>in</strong>ner disc radius [Rsubli] 1, 10, 100<br />
Rout outer disc radius [AU] 100, 300, 500<br />
ɛ column density NH(r) ∝ r−ɛ Rout outer disc radius [AU] 100, 300, 500<br />
ɛ column density NH(r) ∝ r 0.5, 1.0, 1.5<br />
−ɛ Rout outer disc radius [AU] 100, 300, 500<br />
ɛ column density NH(r) ∝ r 0.5, 1.0, 1.5<br />
−ɛ 0.5, 1.0, 1.5<br />
β<br />
r<br />
β flar<strong>in</strong>g H(r) = H0<br />
dust parameter<br />
r0<br />
0.8, 1.0, 1.2<br />
s settl<strong>in</strong>g H(r, a) ∝ H(r) a−s/2 0, 0.5<br />
am<strong>in</strong> m<strong>in</strong>imum gra<strong>in</strong> size [µm] 0.05, 1<br />
radiative transfer parameter<br />
i <strong>in</strong>cl<strong>in</strong>ation 0o , 41.41o , 60o , 75.52o , 90o β flar<strong>in</strong>g H(r) = H0<br />
dust parameter<br />
r0<br />
0.8, 1.0, 1.2<br />
s settl<strong>in</strong>g H(r, a) ∝ H(r) a<br />
(edge-on)<br />
−s/2 0, 0.5<br />
am<strong>in</strong> m<strong>in</strong>imum gra<strong>in</strong> size [µm] 0.05, 1<br />
radiative transfer parameter<br />
i <strong>in</strong>cl<strong>in</strong>ation 0o , 41.41o , 60o , 75.52o , 90o (edge-on)<br />
3. Gas physics and chemistry<br />
200 000 cpu-hours (ANR “Dusty<br />
The large number of disk models makes it impossible to carry<br />
out an <strong>in</strong>dividual study of their chemical and thermal structure.<br />
Hence <strong>in</strong> the follow<strong>in</strong>g, we study the statistics of species gas<br />
temperatures and masses and how they depend on certa<strong>in</strong> grid<br />
Disk” supercomputer, PI: F. Ménard)
HD169142 <strong>in</strong> PAHs<br />
Imag<strong>in</strong>g <strong>in</strong> Mid-IR<br />
VISIR observations<br />
→ disk resolved <strong>in</strong> cont<strong>in</strong>uum<br />
and PAHs bands<br />
Model consistent with<br />
observations<br />
→ confirms amount of PAHs<br />
and geometry of the disk<br />
surface<br />
See also Lagage et al, 2006<br />
and Doucet et al, 2007<br />
J. Ibanez et al.: Extended PAH<br />
Fig. 3. Image of the disk of HD 169142 <strong>in</strong> the cont<strong>in</strong>uum centered at<br />
12.81µm. The image has been PSF subtracted. North is up and East<br />
to the left (VERFIER, Just<strong>in</strong>e, tu confirmes? A distance of 145pc is<br />
assumed.
Spatial orig<strong>in</strong><br />
of the l<strong>in</strong>es<br />
HD 169142<br />
z/r<br />
z/r<br />
z/r<br />
z/r<br />
z/r<br />
0.6<br />
0.4<br />
0.2<br />
0.6<br />
0.4<br />
0.2<br />
0.6<br />
0.4<br />
0.2<br />
0.6<br />
0.4<br />
0.2<br />
0.6<br />
0.4<br />
0.2<br />
0 2 4 6 8<br />
log n O [cm -3 ]<br />
0 2 4 6 8<br />
log n O [cm -3 ]<br />
0 2 4 6 8<br />
log n C+ [cm -3 ]<br />
0 2 4 6 8<br />
log n 12CO [cm -3 ]<br />
0 2 4 6 8<br />
log n 13CO [cm -3 ]<br />
[OI] 63.18µm<br />
[OI] 145.53µm<br />
[CII] 157.74µm<br />
12CO 1300.40µm<br />
13CO 1360.23µm<br />
0.0<br />
0.1 1.0 10.0<br />
r [AU]<br />
100.0
z / r<br />
1.0<br />
0.8<br />
0.6<br />
0.4<br />
0.2<br />
0.0<br />
1.0 1.5 2.0 2.5 3.0 3.5 4.0<br />
log Tg [K]<br />
! ver<br />
Effect of X-ray irradiation<br />
G. Aresu et al.: X-ray impact on the protoplanetary disks around T<br />
! rad<br />
1 10 100<br />
r [AU]<br />
z / r<br />
1.0<br />
0.8<br />
0.6<br />
0.4<br />
0.2<br />
0.0<br />
1.0 1.5 2.0 2.5 3.0 3.5 4.0<br />
log Tg [K]<br />
T gas = 8000 K<br />
! X (1 keV) ! rad<br />
! ver<br />
1 10 100<br />
r [AU]<br />
Fig. 1. Gas temperature distribution: Model 1 (UV only) <strong>in</strong> the left panel, X-ray models wit<br />
10 32 erg s −1 (Model 5) <strong>in</strong> the middle and right panel respectively. Contour l<strong>in</strong>es are over-plo<br />
G. Aresu et al, 2010<br />
depth at 550 nm, dashed l<strong>in</strong>e), τver = 1 (vertical dust optical depth at 550 nm, dotted l<strong>in</strong>e)<br />
keV<br />
Far-IR<br />
(dot-dashed<br />
l<strong>in</strong>es<br />
l<strong>in</strong>e).<br />
significantly<br />
The relative position<br />
affected<br />
of these two<br />
only<br />
depth<br />
if<br />
depend strongly on the assum<br />
solid l<strong>in</strong>e corresponds to Tgas = 8000 K.<br />
LX ≥1031 erg/s<br />
z / r<br />
1.<br />
0.<br />
0.<br />
0.<br />
0.<br />
0.
[OI] 63 µm [W.m −2 ]<br />
Effect of X-ray irradiation<br />
5<br />
2<br />
10 −16<br />
5<br />
2<br />
fPAH = 0.01<br />
fPAH = 0.001<br />
10 +28 10 +29 10 +30 10 +31 10 +32<br />
LX [erg/s]<br />
G. Aresu et al, 2010<br />
Far-IR l<strong>in</strong>es significantly affected only if LX ≥10 31 erg/s
Conclud<strong>in</strong>g remarks<br />
A variety of datasets = f<strong>in</strong>er disk models<br />
•Spatial differentiation is frequent <strong>in</strong> disks around T Tauri<br />
stars<br />
•Similar studies <strong>in</strong> Herbig Ae disks, disks around brown<br />
dwarfs and debris disks are now possible<br />
•Test<strong>in</strong>g the physics of dust gra<strong>in</strong>s towards planet formation:<br />
separate dust populations, non-spherical aggregates?<br />
• Comb<strong>in</strong><strong>in</strong>g f<strong>in</strong>e-structure l<strong>in</strong>es, CO sub-mm l<strong>in</strong>es and dust<br />
observations + detailed modell<strong>in</strong>g is a powerful diagnosis:<br />
ma<strong>in</strong> gas heat<strong>in</strong>g mechanism, dust-to-gas ratios, ...