SERIES

You also want an ePaper? Increase the reach of your titles
YUMPU automatically turns print PDFs into web optimized ePapers that Google loves.
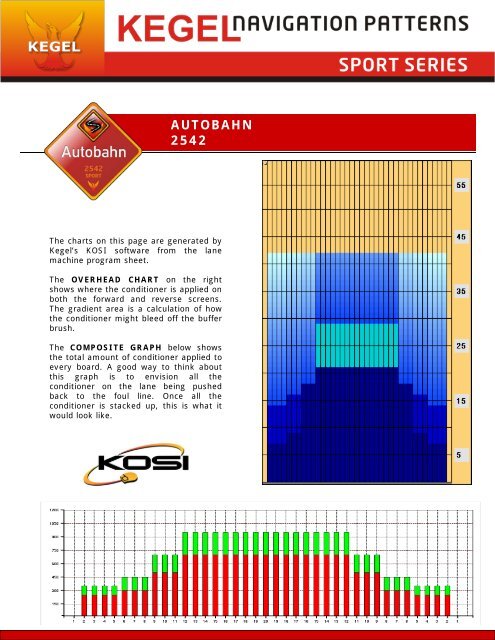
AUTOBAHN<br />
2542<br />
Thechartsonthispagearegeneratedby<br />
Kegel’s KOSI software from the lane<br />
machine program sheet.<br />
The OVERHEAD CHART on the right<br />
shows where the conditioner is applied on<br />
both the forward and reverse screens.<br />
The gradient area is a calculation of how<br />
the conditioner might bleed off the buffer<br />
brush.<br />
The COMPOSITE GRAPH below shows<br />
the total amount of conditioner applied to<br />
every board. A good way to think about<br />
this graph is to envision all the<br />
conditioner on the lane being pushed<br />
back to the foul line. Once all the<br />
conditioner is stacked up, this is what it<br />
would look like.