considering autocorrelation in predictive models - Department of ...
considering autocorrelation in predictive models - Department of ...
considering autocorrelation in predictive models - Department of ...

You also want an ePaper? Increase the reach of your titles
YUMPU automatically turns print PDFs into web optimized ePapers that Google loves.
30 Def<strong>in</strong>ition <strong>of</strong> the Problem<br />
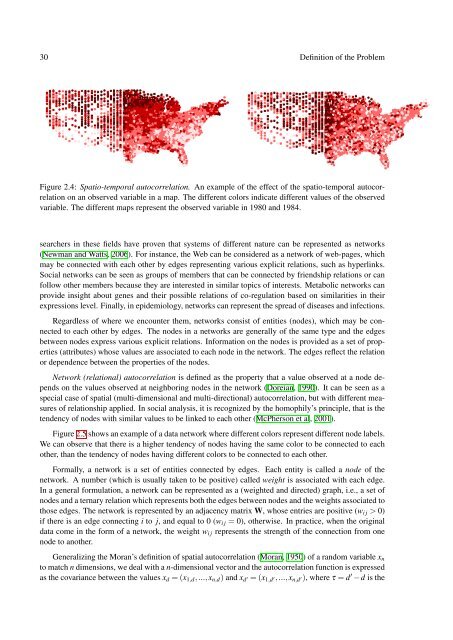
Figure 2.4: Spatio-temporal <strong>autocorrelation</strong>. An example <strong>of</strong> the effect <strong>of</strong> the spatio-temporal <strong>autocorrelation</strong><br />
on an observed variable <strong>in</strong> a map. The different colors <strong>in</strong>dicate different values <strong>of</strong> the observed<br />
variable. The different maps represent the observed variable <strong>in</strong> 1980 and 1984.<br />
searchers <strong>in</strong> these fields have proven that systems <strong>of</strong> different nature can be represented as networks<br />
(Newman and Watts, 2006). For <strong>in</strong>stance, the Web can be considered as a network <strong>of</strong> web-pages, which<br />
may be connected with each other by edges represent<strong>in</strong>g various explicit relations, such as hyperl<strong>in</strong>ks.<br />
Social networks can be seen as groups <strong>of</strong> members that can be connected by friendship relations or can<br />
follow other members because they are <strong>in</strong>terested <strong>in</strong> similar topics <strong>of</strong> <strong>in</strong>terests. Metabolic networks can<br />
provide <strong>in</strong>sight about genes and their possible relations <strong>of</strong> co-regulation based on similarities <strong>in</strong> their<br />
expressions level. F<strong>in</strong>ally, <strong>in</strong> epidemiology, networks can represent the spread <strong>of</strong> diseases and <strong>in</strong>fections.<br />
Regardless <strong>of</strong> where we encounter them, networks consist <strong>of</strong> entities (nodes), which may be connected<br />
to each other by edges. The nodes <strong>in</strong> a networks are generally <strong>of</strong> the same type and the edges<br />
between nodes express various explicit relations. Information on the nodes is provided as a set <strong>of</strong> properties<br />
(attributes) whose values are associated to each node <strong>in</strong> the network. The edges reflect the relation<br />
or dependence between the properties <strong>of</strong> the nodes.<br />
Network (relational) <strong>autocorrelation</strong> is def<strong>in</strong>ed as the property that a value observed at a node depends<br />
on the values observed at neighbor<strong>in</strong>g nodes <strong>in</strong> the network (Doreian, 1990). It can be seen as a<br />
special case <strong>of</strong> spatial (multi-dimensional and multi-directional) <strong>autocorrelation</strong>, but with different measures<br />
<strong>of</strong> relationship applied. In social analysis, it is recognized by the homophily’s pr<strong>in</strong>ciple, that is the<br />
tendency <strong>of</strong> nodes with similar values to be l<strong>in</strong>ked to each other (McPherson et al, 2001).<br />
Figure 2.5 shows an example <strong>of</strong> a data network where different colors represent different node labels.<br />
We can observe that there is a higher tendency <strong>of</strong> nodes hav<strong>in</strong>g the same color to be connected to each<br />
other, than the tendency <strong>of</strong> nodes hav<strong>in</strong>g different colors to be connected to each other.<br />
Formally, a network is a set <strong>of</strong> entities connected by edges. Each entity is called a node <strong>of</strong> the<br />
network. A number (which is usually taken to be positive) called weight is associated with each edge.<br />
In a general formulation, a network can be represented as a (weighted and directed) graph, i.e., a set <strong>of</strong><br />
nodes and a ternary relation which represents both the edges between nodes and the weights associated to<br />
those edges. The network is represented by an adjacency matrix W, whose entries are positive (wi j > 0)<br />
if there is an edge connect<strong>in</strong>g i to j, and equal to 0 (wi j = 0), otherwise. In practice, when the orig<strong>in</strong>al<br />
data come <strong>in</strong> the form <strong>of</strong> a network, the weight wi j represents the strength <strong>of</strong> the connection from one<br />
node to another.<br />
Generaliz<strong>in</strong>g the Moran’s def<strong>in</strong>ition <strong>of</strong> spatial <strong>autocorrelation</strong> (Moran, 1950) <strong>of</strong> a random variable xn<br />
to match n dimensions, we deal with a n-dimensional vector and the <strong>autocorrelation</strong> function is expressed<br />
as the covariance between the values xd = (x1,d,...,xn,d) and xd ′ = (x1,d ′,...,xn,d ′), where τ = d′ −d is the