World-class Coals - November 2007 (complete) (PDF, 2.3 MB)
World-class Coals - November 2007 (complete) (PDF, 2.3 MB)
World-class Coals - November 2007 (complete) (PDF, 2.3 MB)

Create successful ePaper yourself
Turn your PDF publications into a flip-book with our unique Google optimized e-Paper software.
8<br />
Queensland coal production and sales<br />
Overview<br />
In 2006–07, the Queensland coal industry, which is<br />
dominated by large open-cut mines in the Bowen Basin<br />
in central Queensland, expanded coal production and<br />
exports to new record levels despite lower financial<br />
returns from export sales compared to the previous year.<br />
Coal remains Queensland’s most important export<br />
commodity, and continues to provide great benefit to<br />
the State through strong financial returns, increasing<br />
employment opportunities and regional development.<br />
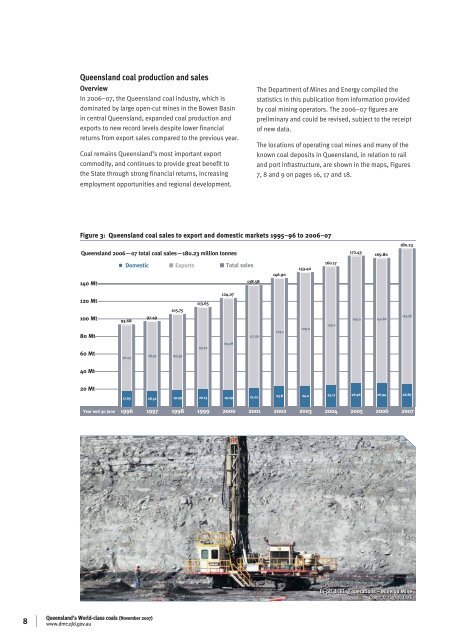
Figure 3: Queensland coal sales to export and domestic markets 1995–96 to 2006–07<br />
Queensland 2006—07 total coal sales—180.23 million tonnes<br />
140 Mt<br />
120 Mt<br />
100 Mt<br />
80 Mt<br />
60 Mt<br />
40 Mt<br />
20 Mt<br />
Year end 30 June<br />
Domestic<br />
93.68<br />
76.03<br />
17.65<br />
97.49<br />
78.97<br />
18.52<br />
Queensland's <strong>World</strong>-<strong>class</strong> coals (<strong>November</strong> <strong>2007</strong>)<br />
www.dme.qld.gov.au<br />
Exports<br />
105.75<br />
86.36<br />
19.39<br />
113.65<br />
93.52<br />
20.13<br />
Total sales<br />
124.07<br />
104.78<br />
19.29<br />
138.58<br />
117.56<br />
21.02<br />
The Department of Mines and Energy compiled the<br />
statistics in this publication from information provided<br />
by coal mining operators. The 2006–07 figures are<br />
preliminary and could be revised, subject to the receipt<br />
of new data.<br />
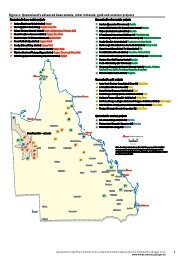
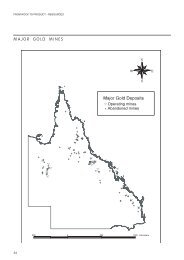
The locations of operating coal mines and many of the<br />
known coal deposits in Queensland, in relation to rail<br />
and port infrastructure, are shown in the maps, Figures<br />
7, 8 and 9 on pages 16, 17 and 18.<br />
146.90<br />
1996 1997 1998 1999 2000 2001 2002 2003 2004 2005<br />
123.1<br />
23.8<br />
153.40<br />
129.2<br />
24.2<br />
160.17<br />
135.0<br />
25.17<br />
172.43<br />
145.5<br />
26.96<br />
169.80<br />
142.86<br />
26.94<br />
2006<br />
180.23<br />
153.36<br />
26.87<br />
<strong>2007</strong><br />
In-pit drilling operations – Minerva Mine<br />
Photo: D. Coffey, DME