Overall Equipment Effectiveness Improvement by TPM and 5S ...
Overall Equipment Effectiveness Improvement by TPM and 5S ...
Overall Equipment Effectiveness Improvement by TPM and 5S ...

Create successful ePaper yourself
Turn your PDF publications into a flip-book with our unique Google optimized e-Paper software.
2001). The overall goal of <strong>TPM</strong> is to raise the overall<br />
equipment effectiveness.<br />
Fig. 3 Calculation of OEE [5]<br />
2. PROBLEM DEFINITION<br />
Historical organizational data showed the <strong>Overall</strong><br />
<strong>Equipment</strong> <strong>Effectiveness</strong> (OEE) value was very low<br />
compared to the general manufacturing scenario. Due to<br />
which the machines were not utilized effectively <strong>and</strong><br />
hence production rate <strong>and</strong> volume was affected.<br />
Figure 4 shows the OEE value of 2 machines LT-2<br />
& Max 65 respectively. These machines had lower OEE<br />
values compared to other machines. These machines<br />
were a part of cell in line production. They were<br />
hindering line efficiency.<br />
Fig. 4 Graph showing OEE of machine for 3 months<br />
The graph clearly shows the OEE values of the<br />
machines for the past 3 months. LT-2 has 43%<br />
efficiency which was far below world class<br />
performance of 85%.<br />
2.1 Problem Statement <strong>and</strong> Project Objective<br />
This study focused on achieving the following<br />
objectives using <strong>TPM</strong> & <strong>5S</strong> methodology:<br />
• To find out the Bottleneck machine in the Cell<br />
layout<br />
• To turn around the bottle neck machine into model<br />
machine & to implement <strong>5S</strong> in the cell layout<br />
• To implement & Validate <strong>TPM</strong> & <strong>5S</strong> practices<br />
2.2 Methodology Followed for Achieving<br />
Target<br />
• Data collection, Machine history study<br />
• Red tagging system for better visuals &<br />
identification of the problems in the machine<br />
• Analysis the problems using Quality tools &<br />
evaluate through Statistical Process Control<br />
techniques.<br />
• Redesigning of cell system to have better<br />
productivity <strong>and</strong> reduction of head counts in the<br />
cell.<br />
• Training of employees to achieve autonomous<br />
maintenance of the machines in the cell layout.<br />
• Maintaining 5s in the machine surrounding.<br />
• Replicating success across the different machines<br />
in the cell layout.<br />
3. MODEL CONSTRUCTION AND<br />
SOLUTION<br />
The project focused on improving the OEE of the<br />
machines as it was the major concern for lower<br />
productions, loss of time <strong>and</strong> money. Figure 5 data<br />
shows how it was affecting the production.<br />
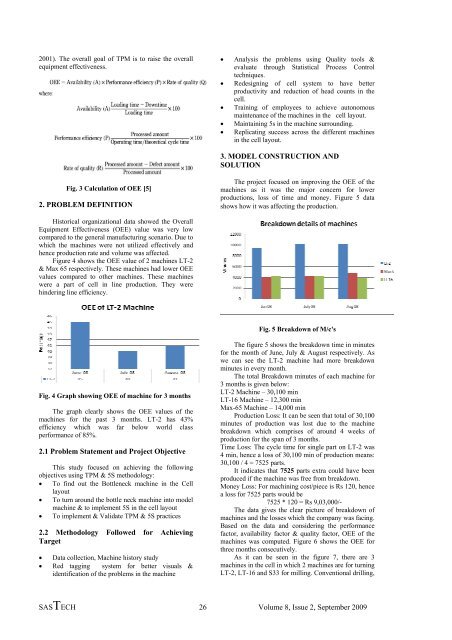
Fig. 5 Breakdown of M/c's<br />
The figure 5 shows the breakdown time in minutes<br />
for the month of June, July & August respectively. As<br />
we can see the LT-2 machine had more breakdown<br />
minutes in every month.<br />
The total Breakdown minutes of each machine for<br />
3 months is given below:<br />
LT-2 Machine – 30,100 min<br />
LT-16 Machine – 12,300 min<br />
Max-65 Machine – 14,000 min<br />
Production Loss: It can be seen that total of 30,100<br />
minutes of production was lost due to the machine<br />
breakdown which comprises of around 4 weeks of<br />
production for the span of 3 months.<br />
Time Loss: The cycle time for single part on LT-2 was<br />
4 min, hence a loss of 30,100 min of production means:<br />
30,100 / 4 = 7525 parts.<br />
It indicates that 7525 parts extra could have been<br />
produced if the machine was free from breakdown.<br />
Money Loss: For machining cost/piece is Rs 120, hence<br />
a loss for 7525 parts would be<br />
7525 * 120 = Rs 9,03,000/-<br />
The data gives the clear picture of breakdown of<br />
machines <strong>and</strong> the losses which the company was facing.<br />
Based on the data <strong>and</strong> considering the performance<br />
factor, availability factor & quality factor, OEE of the<br />
machines was computed. Figure 6 shows the OEE for<br />
three months consecutively.<br />
As it can be seen in the figure 7, there are 3<br />
machines in the cell in which 2 machines are for turning<br />
LT-2, LT-16 <strong>and</strong> S33 for milling. Conventional drilling,<br />
SASTECH 26 Volume 8, Issue 2, September 2009