Comparing Synchronous and Asynchronous Cellular Genetic ... - NEO
Comparing Synchronous and Asynchronous Cellular Genetic ... - NEO
Comparing Synchronous and Asynchronous Cellular Genetic ... - NEO

Create successful ePaper yourself
Turn your PDF publications into a flip-book with our unique Google optimized e-Paper software.
<strong>Synchronous</strong> Line Sweep Fixed R<strong>and</strong>om Sweep New R<strong>and</strong>om Sweep Uniform Choice<br />
MMDP 277950 201887 216300 217850 238850<br />
FMS 560760 543928 427291 480500 534772<br />
P-PEAKS 243300 189550 191700 201400 203350<br />
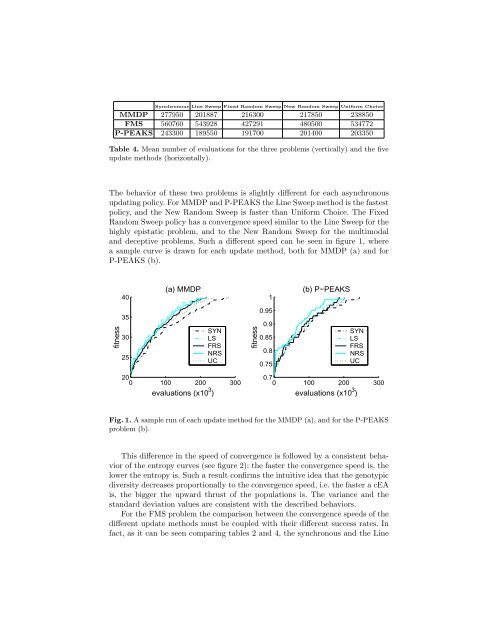
Table 4. Mean number of evaluations for the three problems (vertically) <strong>and</strong> the five<br />
update methods (horizontally).<br />
The behavior of these two problems is slightly different for each asynchronous<br />
updating policy. For MMDP <strong>and</strong> P-PEAKS the Line Sweep method is the fastest<br />
policy, <strong>and</strong> the New R<strong>and</strong>om Sweep is faster than Uniform Choice. The Fixed<br />
R<strong>and</strong>om Sweep policy has a convergence speed similar to the Line Sweep for the<br />
highly epistatic problem, <strong>and</strong> to the New R<strong>and</strong>om Sweep for the multimodal<br />
<strong>and</strong> deceptive problems. Such a different speed can be seen in figure 1, where<br />
a sample curve is drawn for each update method, both for MMDP (a) <strong>and</strong> for<br />
P-PEAKS (b).<br />
fitness<br />
40<br />
35<br />
30<br />
25<br />
(a) MMDP<br />
SYN<br />
LS<br />
FRS<br />
NRS<br />
UC<br />
20<br />
0 100 200 300<br />
evaluations (x10 3 )<br />
fitness<br />
1<br />
0.95<br />
0.9<br />
0.85<br />
0.8<br />
0.75<br />
(b) P−PEAKS<br />
SYN<br />
LS<br />
FRS<br />
NRS<br />
UC<br />
0.7<br />
0 100 200 300<br />
evaluations (x10 3 )<br />
Fig. 1. A sample run of each update method for the MMDP (a), <strong>and</strong> for the P-PEAKS<br />
problem (b).<br />
This difference in the speed of convergence is followed by a consistent behavior<br />
of the entropy curves (see figure 2): the faster the convergence speed is, the<br />
lower the entropy is. Such a result confirms the intuitive idea that the genotypic<br />
diversity decreases proportionally to the convergence speed, i.e. the faster a cEA<br />
is, the bigger the upward thrust of the populations is. The variance <strong>and</strong> the<br />
st<strong>and</strong>ard deviation values are consistent with the described behaviors.<br />
For the FMS problem the comparison between the convergence speeds of the<br />
different update methods must be coupled with their different success rates. In<br />
fact, as it can be seen comparing tables 2 <strong>and</strong> 4, the synchronous <strong>and</strong> the Line