ICF's Report to the Governor - Office of the Governor - Rick Perry
ICF's Report to the Governor - Office of the Governor - Rick Perry
ICF's Report to the Governor - Office of the Governor - Rick Perry

Create successful ePaper yourself
Turn your PDF publications into a flip-book with our unique Google optimized e-Paper software.
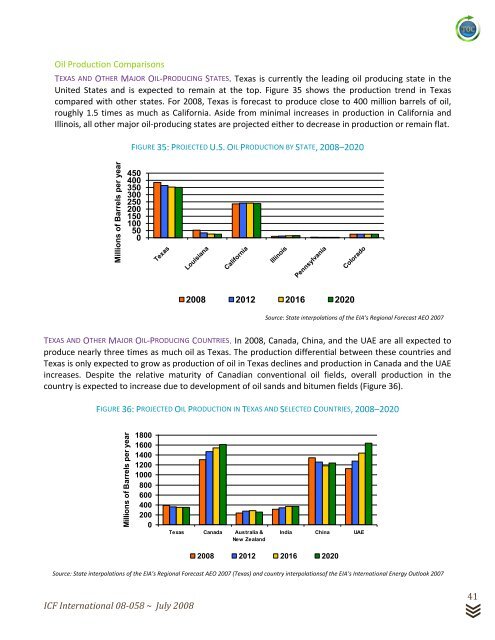
Oil Production Comparisons<br />
TEXAS AND OTHER MAJOR OIL-PRODUCING STATES. Texas is currently <strong>the</strong> leading oil producing state in <strong>the</strong><br />
United States and is expected <strong>to</strong> remain at <strong>the</strong> <strong>to</strong>p. Figure 35 shows <strong>the</strong> production trend in Texas<br />
compared with o<strong>the</strong>r states. For 2008, Texas is forecast <strong>to</strong> produce close <strong>to</strong> 400 million barrels <strong>of</strong> oil,<br />
roughly 1.5 times as much as California. Aside from minimal increases in production in California and<br />
Illinois, all o<strong>the</strong>r major oil-producing states are projected ei<strong>the</strong>r <strong>to</strong> decrease in production or remain flat.<br />
Millions <strong>of</strong> Barrels per year<br />
ICF International 08-058 ~ July 2008<br />
FIGURE 35: PROJECTED U.S. OIL PRODUCTION BY STATE, 2008–2020<br />
Source: State interpolations <strong>of</strong> <strong>the</strong> EIA’s Regional Forecast AEO 2007<br />
TEXAS AND OTHER MAJOR OIL-PRODUCING COUNTRIES. In 2008, Canada, China, and <strong>the</strong> UAE are all expected <strong>to</strong><br />
produce nearly three times as much oil as Texas. The production differential between <strong>the</strong>se countries and<br />
Texas is only expected <strong>to</strong> grow as production <strong>of</strong> oil in Texas declines and production in Canada and <strong>the</strong> UAE<br />
increases. Despite <strong>the</strong> relative maturity <strong>of</strong> Canadian conventional oil fields, overall production in <strong>the</strong><br />
country is expected <strong>to</strong> increase due <strong>to</strong> development <strong>of</strong> oil sands and bitumen fields (Figure 36).<br />
FIGURE 36: PROJECTED OIL PRODUCTION IN TEXAS AND SELECTED COUNTRIES, 2008–2020<br />
Millions <strong>of</strong> Barrels per year<br />
450<br />
400<br />
350<br />
300<br />
250<br />
200<br />
150<br />
100<br />
50<br />
0<br />
1800<br />
1600<br />
1400<br />
1200<br />
1000<br />
800<br />
600<br />
400<br />
200<br />
0<br />
2008 2012 2016 2020<br />
Texas Canada Australia &<br />
New Zealand<br />
India China UAE<br />
2008 2012 2016 2020<br />
Source: State interpolations <strong>of</strong> <strong>the</strong> EIA’s Regional Forecast AEO 2007 (Texas) and country interpolations<strong>of</strong> <strong>the</strong> EIA’s International Energy Outlook 2007<br />
41