Organization-based self-esteem scale – adaptation - Journal of ...
Organization-based self-esteem scale – adaptation - Journal of ...
Organization-based self-esteem scale – adaptation - Journal of ...

You also want an ePaper? Increase the reach of your titles
YUMPU automatically turns print PDFs into web optimized ePapers that Google loves.
Uwe Peter Kanning & Anka Hill 18<br />
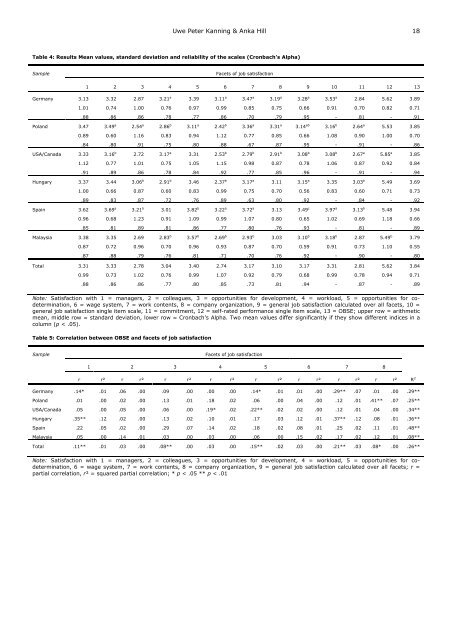
Table 4: Results Mean values, standard deviation and reliability <strong>of</strong> the <strong>scale</strong>s (Cronbach’s Alpha)<br />
Sample Facets <strong>of</strong> job satisfaction<br />
Germany 3.13<br />
1.01<br />
.88<br />
Poland 3.47<br />
0.89<br />
.84<br />
USA/Canada 3.33<br />
1.12<br />
.91<br />
Hungary 3.37<br />
1.00<br />
.89<br />
Spain 3.62<br />
0.96<br />
.85<br />
Malaysia 3.38<br />
0.87<br />
.87<br />
Total 3.31<br />
0.99<br />
.88<br />
1 2 3 4 5 6 7 8 9 10 11 12 13<br />
3.32<br />
0.74<br />
.86<br />
3.49 a<br />
0.60<br />
.80<br />
3.16 b<br />
0.77<br />
.89<br />
3.44<br />
0.66<br />
.83<br />
3.69 a<br />
0.68<br />
.81<br />
3.35<br />
0.72<br />
.88<br />
3.33<br />
0.73<br />
.86<br />
2.87<br />
1.00<br />
.86<br />
2.54 a<br />
1.16<br />
.91<br />
2.72<br />
1.01<br />
.86<br />
3.06 b<br />
0.87<br />
.87<br />
3.21 b<br />
1.23<br />
.89<br />
2.69<br />
0.96<br />
.79<br />
2.78<br />
1.02<br />
.86<br />
3.21 a<br />
0.76<br />
.78<br />
2.86 b<br />
0.83<br />
.75<br />
3.17 a<br />
0.75<br />
.78<br />
2.91 b<br />
0.60<br />
.72<br />
3.01<br />
0.91<br />
.81<br />
2.83 b<br />
0.70<br />
.76<br />
3.04<br />
0.76<br />
.77<br />
3.39<br />
0.97<br />
.77<br />
3.11 a<br />
0.94<br />
.80<br />
3.31<br />
1.05<br />
.84<br />
3.46<br />
0.83<br />
.76<br />
3.82 b<br />
1.09<br />
.86<br />
3.57 b<br />
0.96<br />
.81<br />
3.40<br />
0.99<br />
.80<br />
3.11 a<br />
0.99<br />
.86<br />
2.42 b<br />
1.12<br />
.88<br />
2.53 b<br />
1.15<br />
.92<br />
2.37 b<br />
0.99<br />
.89<br />
3.22 a<br />
0.99<br />
.77<br />
2.69 b<br />
0.93<br />
.71<br />
2.74<br />
1.07<br />
.85<br />
Note: Satisfaction with 1 = managers, 2 = colleagues, 3 = opportunities for development, 4 = workload, 5 = opportunities for codetermination,<br />
6 = wage system, 7 = work contents, 8 = company organization, 9 = general job satisfaction calculated over all facets, 10 =<br />
general job satisfaction single item <strong>scale</strong>, 11 = commitment, 12 = <strong>self</strong>-rated performance single item <strong>scale</strong>, 13 = OBSE; upper row = arithmetic<br />
mean, middle row = standard deviation, lower row = Cronbach’s Alpha. Two mean values differ significantly if they show different indices in a<br />
column (p < .05).<br />
Table 5: Correlation between OBSE and facets <strong>of</strong> job satisfaction<br />
Sample<br />
3.47 a<br />
0.85<br />
.70<br />
3.36 a<br />
0.77<br />
.67<br />
2.79 b<br />
0.98<br />
.77<br />
3.17 a<br />
0.75<br />
.63<br />
3.72 a<br />
1.07<br />
.80<br />
2.93 b<br />
0.87<br />
.70<br />
3.17<br />
0.92<br />
.73<br />
Facets <strong>of</strong> job satisfaction<br />
1 2 3 4 5 6 7 8<br />
r r² r r² r r² r r² r r² r r² r r² r r²<br />
Germany .14* .01 .06 .00 .09 .00 .00 .00 .14* .01 .01 .00 .29** .07 .01 .00 .29**<br />
Poland .01 .00 .02 .00 .13 .01 .18 .02 .06 .00 .04 .00 .12 .01 .41** .07 .25**<br />
USA/Canada .05 .00 .05 .00 .06 .00 .19* .02 .22** .02 .02 .00 .12 .01 .04 .00 .34**<br />
Hungary .35** .12 .02 .00 .13 .02 .10 .01 .17 .03 .12 .01 .37** .12 .08 .01 .36**<br />
Spain .22 .05 .02 .00 .29 .07 .14 .02 .18 .02 .08 .01 .25 .02 .11 .01 .48**<br />
Malaysia .05 .00 .14 .01 .03 .00 .03 .00 .06 .00 .15 .02 .17 .02 .12 .01 .08**<br />
Total .11** .01 .03 .00 .08** .00 .03 .00 .15** .02 .03 .00 .21** .03 .08* .00 .26**<br />
Note: Satisfaction with 1 = managers, 2 = colleagues, 3 = opportunities for development, 4 = workload, 5 = opportunities for codetermination,<br />
6 = wage system, 7 = work contents, 8 = company organization, 9 = general job satisfaction calculated over all facets; r =<br />
partial correlation, r² = squared partial correlation; * p < .05 ** p < .01<br />
3.19 a<br />
0.75<br />
.79<br />
3.31 a<br />
0.85<br />
.87<br />
2.91 b<br />
0.87<br />
.85<br />
3.11<br />
0.70<br />
.80<br />
3.13<br />
0.80<br />
.76<br />
3.03<br />
0.70<br />
.76<br />
3.10<br />
0.79<br />
.81<br />
3.28 a<br />
0.66<br />
.95<br />
3.14 ab<br />
0.66<br />
.95<br />
3.08 b<br />
0.78<br />
.96<br />
3.15 a<br />
0.56<br />
.92<br />
3.49 c<br />
0.65<br />
.93<br />
3.10 b<br />
0.59<br />
.92<br />
3.17<br />
0.68<br />
.94<br />
3.53 a<br />
0.91<br />
-<br />
3.16 b<br />
1.08<br />
-<br />
3.08 b<br />
1.06<br />
-<br />
3.35<br />
0.83<br />
-<br />
3.97 a<br />
1.02<br />
-<br />
3.18 b<br />
0.91<br />
-<br />
3.31<br />
0.99<br />
-<br />
2.84<br />
0.70<br />
.81<br />
2.64 a<br />
0.90<br />
.91<br />
2.67 a<br />
0.87<br />
.91<br />
3.03 b<br />
0.60<br />
.84<br />
3.13 b<br />
0.69<br />
.81<br />
2.87<br />
0.73<br />
.90<br />
2.81<br />
0.78<br />
.87<br />
5.62<br />
0.82<br />
-<br />
5.53<br />
1.00<br />
-<br />
5.85 a<br />
0.92<br />
-<br />
5.49<br />
0.71<br />
-<br />
5.48<br />
1.18<br />
-<br />
5.49 b<br />
1.10<br />
-<br />
5.62<br />
0.94<br />
-<br />
3.89<br />
0.71<br />
.91<br />
3.85<br />
0.70<br />
.86<br />
3.85<br />
0.84<br />
.94<br />
3.69<br />
0.73<br />
.92<br />
3.94<br />
0.66<br />
.89<br />
3.79<br />
0.55<br />
.80<br />
3.84<br />
0.71<br />
.89<br />
R 2