

Visualizing Topic Flow in Students' Essays - Educational ...
Visualizing Topic Flow in Students' Essays - Educational ...
Visualizing Topic Flow in Students' Essays - Educational ...

You also want an ePaper? Increase the reach of your titles
YUMPU automatically turns print PDFs into web optimized ePapers that Google loves.
i<br />
j<br />
d ˆ d<br />
ij<br />
<br />
2<br />
dˆ (3)<br />
ij<br />
2<br />
ij<br />
<strong>Visualiz<strong>in</strong>g</strong> <strong>Flow</strong><br />
A well structured essay should have a clear and logical flow of ideas represented through its flow <strong>in</strong> paragraphs. The<br />
2-dimensional visual representation can be used by students to reflect on the correctness of each argument (i.e. how<br />
each argument po<strong>in</strong>t follows each other). The visualization may also help detect ‘breaks’ <strong>in</strong> the flow, which is when<br />
two consecutive paragraphs talk about very different topics. The visualization presents the document <strong>in</strong> a different<br />
way, as it might appear for an external reader. In a paragraph ‘map’ such as the one <strong>in</strong> Figure 1, the essay’s<br />
paragraphs are plotted on a circular grid with the diameter of the grid equal to the maximum possible distance<br />
between any two paragraphs (i.e. no topic overlap). The paragraphs are represented us<strong>in</strong>g a node-l<strong>in</strong>k diagram with<br />
text labels and arrows used to <strong>in</strong>dicate the paragraph sequence.<br />
For example, the clear sequence of topics <strong>in</strong> the five paragraph essay paradigm (Davis & Liss, 2006), can be<br />
visualized <strong>in</strong> our map. In this particular genre, the content of the ‘<strong>in</strong>troduction’ and ‘conclusion’ paragraphs is<br />
expected to be similar, so these paragraphs should appear close <strong>in</strong> a map. The ‘body’ paragraphs address different<br />
subtopics and should ideally be l<strong>in</strong>ked through transitions so they should be sequentially positioned <strong>in</strong> the map. The<br />
map of a well structured ideal five paragraph essay would have a circular layout of sequential paragraphs, <strong>in</strong>dicat<strong>in</strong>g<br />
a natural change <strong>in</strong> topic over the essay, with the <strong>in</strong>troduction and conclusion start<strong>in</strong>g and f<strong>in</strong>ish<strong>in</strong>g on similar po<strong>in</strong>ts.<br />
In contrast, we would expect a poorly structured essay to have many rough shifts <strong>in</strong> topic, with paragraphs positioned<br />
somewhat randomly around the map.<br />
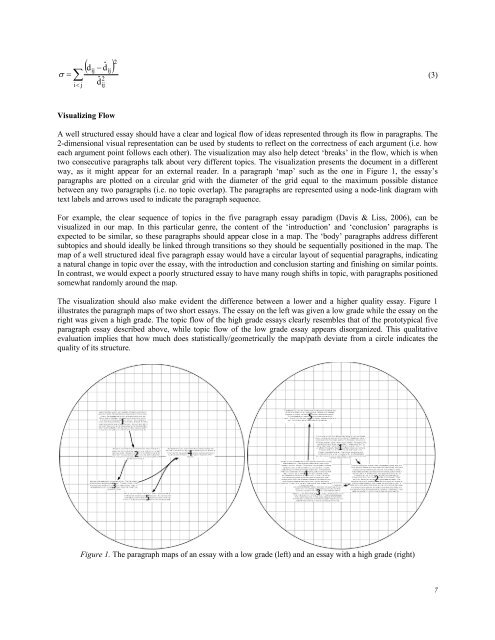
The visualization should also make evident the difference between a lower and a higher quality essay. Figure 1<br />
illustrates the paragraph maps of two short essays. The essay on the left was given a low grade while the essay on the<br />
right was given a high grade. The topic flow of the high grade essays clearly resembles that of the prototypical five<br />
paragraph essay described above, while topic flow of the low grade essay appears disorganized. This qualitative<br />
evaluation implies that how much does statistically/geometrically the map/path deviate from a circle <strong>in</strong>dicates the<br />
quality of its structure.<br />
Figure 1. The paragraph maps of an essay with a low grade (left) and an essay with a high grade (right)<br />
7


