Russian Issue 3 - Harvard University Department of Physics
Russian Issue 3 - Harvard University Department of Physics
Russian Issue 3 - Harvard University Department of Physics

You also want an ePaper? Increase the reach of your titles
YUMPU automatically turns print PDFs into web optimized ePapers that Google loves.
-Radiation & Risk", 1993, <strong>Issue</strong> 3<br />
assumed that since 1990,12991 the main role in<br />
137 Cs decontamination <strong>of</strong> agricultural produce<br />
will be played by the "slow" component.<br />
The statistical distributions <strong>of</strong> specific activity<br />
with respect to the mean in different kinds <strong>of</strong><br />
agricultural produce are presented in Fig. 5-7<br />
and Table 13.<br />
The presented data suggest that all distributions<br />
<strong>of</strong> activity by products and in human body<br />
99.9<br />
99<br />
95<br />
80<br />
50<br />
20<br />
5<br />
^ r<br />
1 f " *<br />
^<br />
* *<br />
0.1<br />
-2.5 -1.5 -0.5 0.5 L.5<br />
InCAij/Aj)<br />
Scientific Articles<br />
can be approximated by lognormal dependence<br />
with close values <strong>of</strong> fig <strong>of</strong> about 1.8.<br />
This is <strong>of</strong> principal importance for the scope<br />
and frequency <strong>of</strong> radiation monitoring. If there<br />
are no additional sources <strong>of</strong> activity in a settlement,<br />
it is enough to determine the mean value<br />
and then use data <strong>of</strong> Figs. 4-7 and Table 13.<br />
1<br />
Pasture grass p<br />
*<br />
V<br />
-"i<br />
r f<br />
^ m •<br />
: ^<br />
2.5 3.5<br />
Fig. 5. Distribution <strong>of</strong> logarithm <strong>of</strong> relative concentration <strong>of</strong> 137 Cs in pasture grass samples<br />
in the vicinity <strong>of</strong> settlement.<br />
99.9<br />
99<br />
95<br />
BO<br />
50<br />
30<br />
»#»»<br />
Pol tato 1<br />
^^r i<br />
0.1 1! '<br />
-1.6 -0.8 0.4<br />
„ lnCAjj/Aj)<br />
J .<br />
*—;—•— •<br />
Fig. 6. Distribution <strong>of</strong> logarithm <strong>of</strong> relative concentration <strong>of</strong> 137 Cs in potato samples<br />
in the vicinity <strong>of</strong> settlement.<br />
86<br />
1.4<br />
3.4<br />
'Radiation & Risk', 1993, issue 3<br />
99,9<br />
99<br />
95<br />
80<br />
50<br />
F.%<br />
20<br />
u9 J'<br />
Milk i<br />
1 ..-*<br />
f<br />
0.1 •<br />
•<br />
f<br />
•3.6 -2.6 -1.6 -0.8 0.4 L4 2.4<br />
ln(AM/Aj)<br />
!<br />
* *<br />
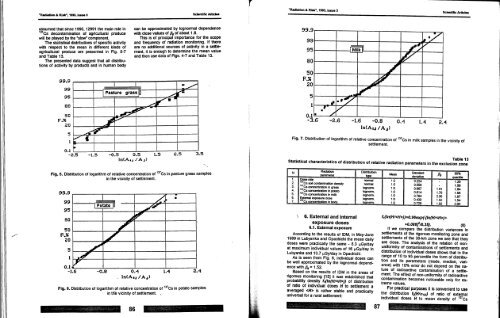
Scientific Articles<br />
Fig. 7. Distribution <strong>of</strong> logarithm <strong>of</strong> relative concentration <strong>of</strong> 137 Cs in milk samples in the vicinity <strong>of</strong><br />
settlement.<br />
Table 13<br />
Statistical characteristics <strong>of</strong> distribution <strong>of</strong> relative radiation parameters in the exclusion zone<br />
N<br />
1.<br />
2.<br />
3.<br />
4.<br />
5.<br />
6.<br />
7.<br />
Radiation<br />
parameter<br />
Dose rate<br />
" r Cs soil contamination density<br />
" r Cs concentration in grass<br />
157<br />
Cs concentration in potato<br />
137<br />
Cs concentration in milk<br />
External exposure dose<br />
,37<br />
Cs concentration in body<br />
\ 6. External and internal<br />
exposure doses<br />
6.1. External exposure<br />
Distribution<br />
type<br />
normal<br />
normal<br />
tognorm.<br />
lognorm.<br />
lognorm.<br />
lognorm.<br />
lognorm.<br />
According to the results <strong>of</strong> IDM, in May-June<br />
1989 in Lubyanka and Opachichi the mean daily<br />
doses were practically the same - 8.3 uGy/day<br />
at maximum individual values <strong>of</strong> 16 ^Gy/day in<br />
Lubyanka and 13.7 u,Gy/day in Opachichi.<br />
As is seen from Fig. 8, individual doses can<br />
be well approximated by the lognormal dependence<br />
with pg = 1.52.<br />
Based on the results <strong>of</strong> IDM in the areas <strong>of</strong><br />
rigorous monitoring [15] it was established that<br />
probability density fi(ln(H/)) <strong>of</strong> distribution<br />
<strong>of</strong> ratio <strong>of</strong> individual doses H to settlement a<br />
averaged is rather stable and practically<br />
universal for a rural settlement:<br />
87<br />
Mean<br />
1.0<br />
1.0<br />
1.0<br />
1.0<br />
1.0<br />
1.0<br />
1.0<br />
Standard<br />
deviation<br />
0.224<br />
0.558<br />
0.667<br />
0.614<br />
0.784<br />
0.439<br />
0.729<br />
A<br />
1.81<br />
1.76<br />
2.00<br />
1.52<br />
1.92<br />
f1(ln(H/))=0.96exp{-[ln(H/)+<br />
90%<br />
quantite<br />
1.29 3<br />
1.56<br />
1.64<br />
1.58<br />
1.87<br />
1.54<br />
2.00<br />
+0.088f/0.3S}. (8)<br />
If we compare the distribution variances in<br />
settlements <strong>of</strong> the rigorous monitoring zone and<br />
settlements <strong>of</strong> the 30-km zone we see that they<br />
are close. The analysis <strong>of</strong> the relation <strong>of</strong> nonuniformity<br />
<strong>of</strong> contaminations <strong>of</strong> settlements and<br />
distribution <strong>of</strong> individual doses shows that in the<br />
range <strong>of</strong> 10 to 95 percentile the form <strong>of</strong> distribution<br />
and its parameters (mode, median, variance)<br />
with 10% error do not depend on the nature<br />
<strong>of</strong> radioactive contamination <strong>of</strong> a settlement.<br />
The effect <strong>of</strong> non-uniformity <strong>of</strong> radioactive<br />
contamination becomes noticeable only for extreme<br />
values.<br />
For practical purposes it is convenient to use<br />
the distribution f^H/am) <strong>of</strong> ratio <strong>of</strong> external<br />
individual doses H to mean density <strong>of</strong> 137 Cs