Miniaturisation for chemistry, physics, biology, materials science and ...
Miniaturisation for chemistry, physics, biology, materials science and ...
Miniaturisation for chemistry, physics, biology, materials science and ...

Create successful ePaper yourself
Turn your PDF publications into a flip-book with our unique Google optimized e-Paper software.
Downloaded by University of Michigan Library on 22 August 2012<br />
Published on 15 June 2012 on http://pubs.rsc.org | doi:10.1039/C2LC40509A<br />
true that these optics-integrated plat<strong>for</strong>ms are not applied <strong>for</strong><br />
cellular phenotyping. Current cellular phenotyping studies using<br />
SERS-based optofluidic device still focus on sample manipulation<br />
to precisely monitoring intracellular contents.<br />
For example, Zhang et al. 82 studied the chemical dynamics<br />
inside a living cell by SERS with an improved sample h<strong>and</strong>ling<br />
capability within a microfluidic channel. The researchers<br />
demonstrated integration of a wide range of technologies<br />
including microfluidics, surface-enhanced Raman scattering,<br />
<strong>and</strong> confocal micro spectroscopy. This approach permitted in<br />
situ characterization of single living CHO (Chinese hamster<br />
ovary) cells with a high degree of spatial (in three dimensions)<br />
<strong>and</strong> temporal (1 s per spectrum acquisition) resolution. This<br />
study introduced gold nanoparticles of 50 nm in diameter into<br />
the cells by passive uptake to enhance the Raman signals.<br />
Furthermore, the study developed a Y-shaped (two inlets, <strong>and</strong><br />
one outlet) microfluidic network to investigate the dynamic<br />
response of the cells. The assay delivered the cell suspension from<br />
one inlet of a microfluidic chip, while test solutions were<br />
introduced from another inlet <strong>for</strong> better control of chemicals in<br />
the temporal domain. With this setup, the researchers successfully<br />
measured the real-time Raman spectral signatures from the<br />
cells undergoing the agonist-evoked Ca 2+ flux process induced<br />
by their exposure to a continuous flow of ionomycin.<br />
Another example is a fast, highly specific <strong>and</strong> reliable bacteria<br />
detection plat<strong>for</strong>m by Walter et al. 83 The study developed a<br />
SERS-based microfluidic system to enable generation of reproducible<br />
<strong>and</strong> specific Raman spectral signature patterns as well as<br />
establishment of large databases <strong>for</strong> statistical analysis. In this<br />
work, the SERS spectra were taken from ultrasonically burst<br />
bacteria. The spectral signatures were used to probe phenotype<br />
in<strong>for</strong>mation originating from the cell wall as well as the bacterial<br />
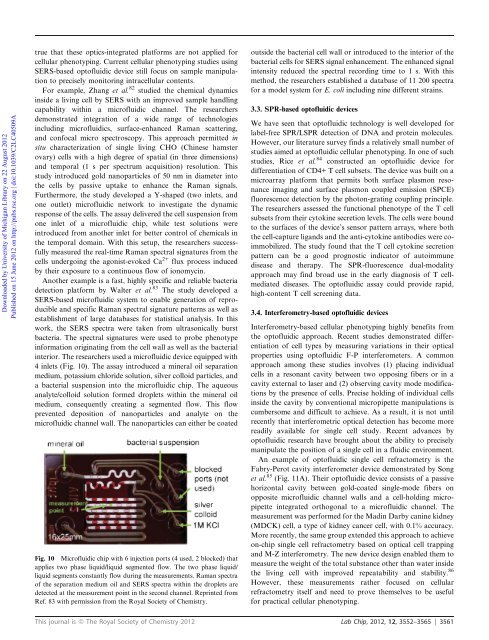
interior. The researchers used a microfluidic device equipped with<br />
4 inlets (Fig. 10). The assay introduced a mineral oil separation<br />
medium, potassium chloride solution, silver colloid particles, <strong>and</strong><br />
a bacterial suspension into the microfluidic chip. The aqueous<br />
analyte/colloid solution <strong>for</strong>med droplets within the mineral oil<br />
medium, consequently creating a segmented flow. This flow<br />
prevented deposition of nanoparticles <strong>and</strong> analyte on the<br />
microfluidic channel wall. The nanoparticles can either be coated<br />
Fig. 10 Microfluidic chip with 6 injection ports (4 used, 2 blocked) that<br />
applies two phase liquid/liquid segmented flow. The two phase liquid/<br />
liquid segments constantly flow during the measurements. Raman spectra<br />
of the separation medium oil <strong>and</strong> SERS spectra within the droplets are<br />
detected at the measurement point in the second channel. Reprinted from<br />
Ref. 83 with permission from the Royal Society of Chemistry.<br />
outside the bacterial cell wall or introduced to the interior of the<br />
bacterial cells <strong>for</strong> SERS signal enhancement. The enhanced signal<br />
intensity reduced the spectral recording time to 1 s. With this<br />
method, the researchers established a database of 11 200 spectra<br />
<strong>for</strong> a model system <strong>for</strong> E. coli including nine different strains.<br />
3.3. SPR-based optofluidic devices<br />
We have seen that optofluidic technology is well developed <strong>for</strong><br />
label-free SPR/LSPR detection of DNA <strong>and</strong> protein molecules.<br />
However, our literature survey finds a relatively small number of<br />
studies aimed at optofluidic cellular phenotyping. In one of such<br />
studies, Rice et al. 84 constructed an optofluidic device <strong>for</strong><br />
differentiation of CD4+ T cell subsets. The device was built on a<br />
microarray plat<strong>for</strong>m that permits both surface plasmon resonance<br />
imaging <strong>and</strong> surface plasmon coupled emission (SPCE)<br />
fluorescence detection by the photon-grating coupling principle.<br />
The researchers assessed the functional phenotype of the T cell<br />
subsets from their cytokine secretion levels. The cells were bound<br />
to the surfaces of the device’s sensor pattern arrays, where both<br />
the cell-capture lig<strong>and</strong>s <strong>and</strong> the anti-cytokine antibodies were coimmobilized.<br />
The study found that the T cell cytokine secretion<br />
pattern can be a good prognostic indicator of autoimmune<br />
disease <strong>and</strong> therapy. The SPR-fluorescence dual-modality<br />
approach may find broad use in the early diagnosis of T cellmediated<br />
diseases. The optofluidic assay could provide rapid,<br />
high-content T cell screening data.<br />
3.4. Interferometry-based optofluidic devices<br />
Interferometry-based cellular phenotyping highly benefits from<br />
the optofluidic approach. Recent studies demonstrated differentiation<br />
of cell types by measuring variations in their optical<br />
properties using optofluidic F-P interferometers. A common<br />
approach among these studies involves (1) placing individual<br />
cells in a resonant cavity between two opposing fibers or in a<br />
cavity external to laser <strong>and</strong> (2) observing cavity mode modifications<br />
by the presence of cells. Precise holding of individual cells<br />
inside the cavity by conventional micropipette manipulations is<br />
cumbersome <strong>and</strong> difficult to achieve. As a result, it is not until<br />
recently that interferometric optical detection has become more<br />
readily available <strong>for</strong> single cell study. Recent advances by<br />
optofluidic research have brought about the ability to precisely<br />
manipulate the position of a single cell in a fluidic environment.<br />
An example of optofluidic single cell refractometry is the<br />
Fabry-Perot cavity interferometer device demonstrated by Song<br />
et al. 85 (Fig. 11A). Their optofluidic device consists of a passive<br />
horizontal cavity between gold-coated single-mode fibers on<br />
opposite microfluidic channel walls <strong>and</strong> a cell-holding micropipette<br />
integrated orthogonal to a microfluidic channel. The<br />
measurement was per<strong>for</strong>med <strong>for</strong> the Madin Darby canine kidney<br />
(MDCK) cell, a type of kidney cancer cell, with 0.1% accuracy.<br />
More recently, the same group extended this approach to achieve<br />
on-chip single cell refractometry based on optical cell trapping<br />
<strong>and</strong> M-Z interferometry. The new device design enabled them to<br />
measure the weight of the total substance other than water inside<br />
the living cell with improved repeatability <strong>and</strong> stability. 86<br />
However, these measurements rather focused on cellular<br />
refractometry itself <strong>and</strong> need to prove themselves to be useful<br />
<strong>for</strong> practical cellular phenotyping.<br />
This journal is ß The Royal Society of Chemistry 2012 Lab Chip, 2012, 12, 3552–3565 | 3561