Interim report for Duni AB (publ) 1 January – 31 December 2008 ...
Interim report for Duni AB (publ) 1 January – 31 December 2008 ...
Interim report for Duni AB (publ) 1 January – 31 December 2008 ...

You also want an ePaper? Increase the reach of your titles
YUMPU automatically turns print PDFs into web optimized ePapers that Google loves.
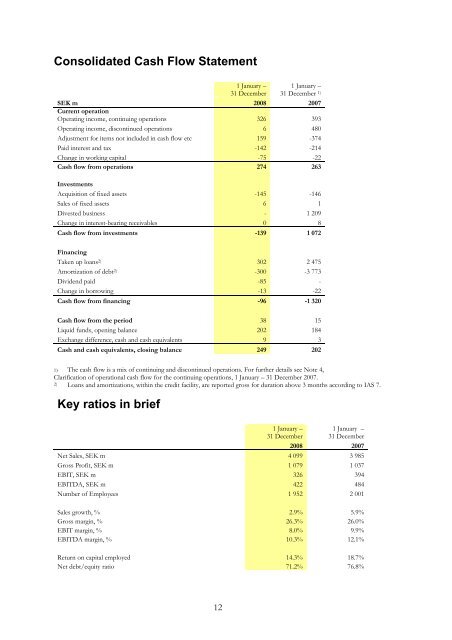
Consolidated Cash Flow Statement<br />
1 <strong>January</strong> <strong>–</strong><br />
<strong>31</strong> <strong>December</strong><br />
1 <strong>January</strong> <strong>–</strong><br />
<strong>31</strong> <strong>December</strong> 1)<br />
SEK m <strong>2008</strong> 2007<br />
Current operation<br />
Operating income, continuing operations 326 393<br />
Operating income, discontinued operations 6 480<br />
Adjustment <strong>for</strong> items not included in cash flow etc 159 -374<br />
Paid interest and tax -142 -214<br />
Change in working capital -75 -22<br />
Cash flow from operations 274 263<br />
Investments<br />
Acquisition of fixed assets -145 -146<br />
Sales of fixed assets 6 1<br />
Divested business - 1 209<br />
Change in interest-bearing receivables 0 8<br />
Cash flow from investments -139 1 072<br />
Financing<br />
Taken up loans2) 302 2 475<br />
Amortization of debt2) -300 -3 773<br />
Dividend paid -85 -<br />
Change in borrowing -13 -22<br />
Cash flow from financing -96 -1 320<br />
Cash flow from the period 38 15<br />
Liquid funds, opening balance 202 184<br />
Exchange difference, cash and cash equivalents 9 3<br />
Cash and cash equivalents, closing balance 249 202<br />
1) The cash flow is a mix of continuing and discontinued operations. For further details see Note 4,<br />
Clarification of operational cash flow <strong>for</strong> the continuing operations, 1 <strong>January</strong> <strong>–</strong> <strong>31</strong> <strong>December</strong> 2007.<br />
2) Loans and amortizations, within the credit facility, are <strong>report</strong>ed gross <strong>for</strong> duration above 3 months according to IAS 7.<br />
Key ratios in brief<br />
1 <strong>January</strong> <strong>–</strong> 1 <strong>January</strong> <strong>–</strong><br />
<strong>31</strong> <strong>December</strong> <strong>31</strong> <strong>December</strong><br />
<strong>2008</strong> 2007<br />
Net Sales, SEK m 4 099 3 985<br />
Gross Profit, SEK m 1 079 1 037<br />
EBIT, SEK m 326 394<br />
EBITDA, SEK m 422 484<br />
Number of Employees 1 952 2 001<br />
Sales growth, % 2.9% 5.9%<br />
Gross margin, % 26.3% 26.0%<br />
EBIT margin, % 8.0% 9.9%<br />
EBITDA margin, % 10.3% 12.1%<br />
Return on capital employed 14.3% 18.7%<br />
Net debt/equity ratio 71.2% 76.8%<br />
12 2