ORNL-TM-4221 - the Molten Salt Energy Technologies Web Site
ORNL-TM-4221 - the Molten Salt Energy Technologies Web Site
ORNL-TM-4221 - the Molten Salt Energy Technologies Web Site

You also want an ePaper? Increase the reach of your titles
YUMPU automatically turns print PDFs into web optimized ePapers that Google loves.
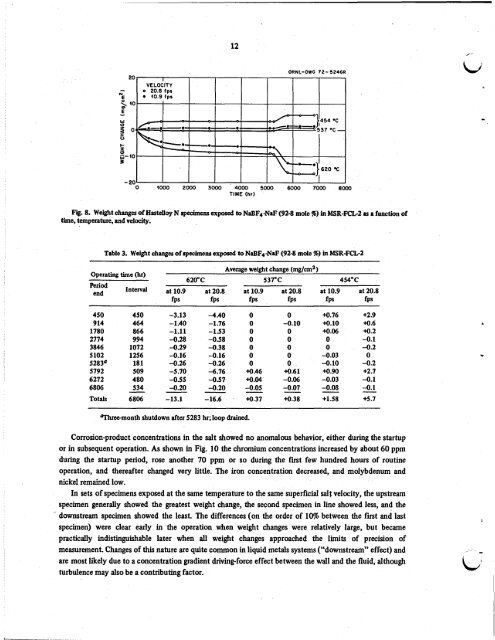
12<br />
<strong>ORNL</strong>-DWG 72- 524613<br />
20 ; I I I I I 1<br />
0 I000 2000 3000 4000 SO00 6000 7000 8000<br />
TIME (hr)<br />
Fig. 8. Weight change of Hastelloy N specimens exposed to NaBF4-NaF (92-8 mole %) in MSR-FCL-2 as a function of<br />
time, temperature, and velocity.<br />
Table 3. Weight changes of specimens exposed to NaBF4NIF (92-8 mole %) in MSR-FCL-2<br />
Operating time (hr)<br />
450<br />
9 14<br />
1780<br />
2774<br />
3846<br />
5 102<br />
5283O<br />
5792<br />
6272<br />
6806<br />
Totals<br />
450<br />
464<br />
866<br />
994<br />
1072<br />
1256<br />
181<br />
509<br />
480<br />
534<br />
6806<br />
-<br />
-3.13<br />
-1.40<br />
-1.11<br />
-0.28<br />
-0.29<br />
-0.16<br />
-0.26<br />
-5.70<br />
-0.55<br />
-0.20<br />
-13.1<br />
Average weight change (mg/cm2)<br />
620°C 53TC 454°C<br />
-4.40<br />
-1.76<br />
-1.53<br />
-0.58<br />
-0.38<br />
-0.16<br />
-0.26<br />
-6.76<br />
-0.57<br />
-0.20<br />
-16.6<br />
%me-month shutdown after 5283 hr; loop drained.<br />
0<br />
0<br />
0<br />
0<br />
0<br />
0<br />
0<br />
M.46<br />
+om<br />
-<br />
-0.05<br />
M.37<br />
0<br />
-0.10<br />
0<br />
0<br />
0<br />
0<br />
0<br />
M.61<br />
-0.06<br />
-0.07<br />
M.38<br />
-<br />
+o.76<br />
N.10<br />
M.06<br />
0<br />
0<br />
-0.03<br />
-0.10<br />
N.90<br />
-0.03<br />
-0.08<br />
-<br />
+1.58<br />
+2.9<br />
M.6<br />
M.2<br />
-0.1<br />
-0.2<br />
0<br />
-0.2<br />
+2.7<br />
-0.1<br />
-0.1<br />
+5.7<br />
Corrosion-product concentrations in <strong>the</strong> salt showed no anomalous behavior, ei<strong>the</strong>r during <strong>the</strong> startup<br />
or in subsequent operation. As shown in Fig. 10 <strong>the</strong> chromium concentrations increased by about 60 pprn<br />
during <strong>the</strong> startup period, rose ano<strong>the</strong>r 70 ppm or so during <strong>the</strong> first few hundred hours of routine<br />
operation, and <strong>the</strong>reafter changed very little. The iron concentration decreased, and molybdenum and<br />
nickel remained low.<br />
In sets of specimens exposed at <strong>the</strong> same temperature to <strong>the</strong> same superficial salt velocity, <strong>the</strong> upstream<br />
specimen generally showed <strong>the</strong> greatest weight change, <strong>the</strong> second specimen in line showed less, and <strong>the</strong><br />
. downstream specimen showed <strong>the</strong> least. The differences (on <strong>the</strong> order of 10% between <strong>the</strong> first and last<br />
specimen) were clear early in <strong>the</strong> operation when weight changes were relatively large, but became<br />
practically indistinguishable later when all weight changes approached <strong>the</strong> limits of precision of<br />
measurement. Changes of this nature are quite common in liquid metals systems (“downstream” effect) and<br />
are most likely due to a concentration gradient driving-force effect between <strong>the</strong> wall and <strong>the</strong> fluid, although<br />
turbulence may also be a contributing factor.<br />
-<br />
,<br />
.
![Review of Molten Salt Reactor Physics Calculations [Disc 2]](https://img.yumpu.com/21979492/1/190x247/review-of-molten-salt-reactor-physics-calculations-disc-2.jpg?quality=85)