Magnetic resonance imaging of ligaments and membranes in the ...
Magnetic resonance imaging of ligaments and membranes in the ...
Magnetic resonance imaging of ligaments and membranes in the ...

Create successful ePaper yourself
Turn your PDF publications into a flip-book with our unique Google optimized e-Paper software.
Acta Radiol Downloaded from <strong>in</strong>formahealthcare.com by McMaster University on 11/20/10<br />
For personal use only.<br />
208<br />
R. Dullerud et al.<br />
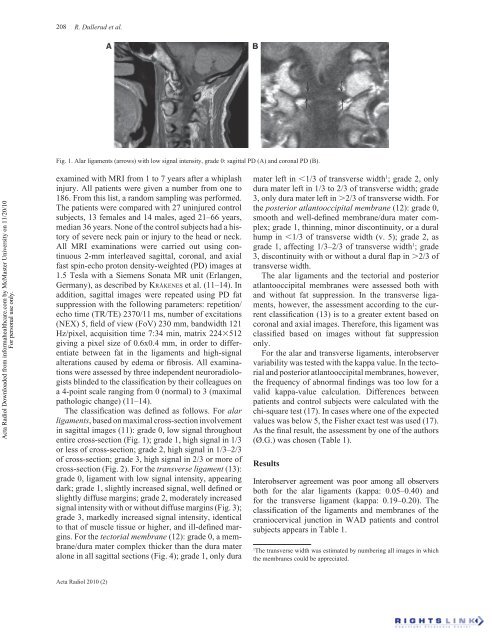
Fig. 1. Alar <strong>ligaments</strong> (arrows) with low signal <strong>in</strong>tensity, grade 0: sagittal PD (A) <strong>and</strong> coronal PD (B).<br />
exam<strong>in</strong>ed with MRI from 1 to 7 years after a whiplash<br />
<strong>in</strong>jury. All patients were given a number from one to<br />
186. From this list, a r<strong>and</strong>om sampl<strong>in</strong>g was performed.<br />
The patients were compared with 27 un<strong>in</strong>jured control<br />
subjects, 13 females <strong>and</strong> 14 males, aged 21–66 years,<br />
median 36 years. None <strong>of</strong> <strong>the</strong> control subjects had a history<br />
<strong>of</strong> severe neck pa<strong>in</strong> or <strong>in</strong>jury to <strong>the</strong> head or neck.<br />
All MRI exam<strong>in</strong>ations were carried out us<strong>in</strong>g cont<strong>in</strong>uous<br />
2-mm <strong>in</strong>terleaved sagittal, coronal, <strong>and</strong> axial<br />
fast sp<strong>in</strong>-echo proton density-weighted (PD) images at<br />
1.5 Tesla with a Siemens Sonata MR unit (Erlangen,<br />
Germany), as described by KRÅKENES et al. (11–14). In<br />
addition, sagittal images were repeated us<strong>in</strong>g PD fat<br />
suppression with <strong>the</strong> follow<strong>in</strong>g parameters: repetition/<br />
echo time (TR/TE) 2370/11 ms, number <strong>of</strong> excitations<br />
(NEX) 5, fi eld <strong>of</strong> view (FoV) 230 mm, b<strong>and</strong>width 121<br />
Hz/pixel, acquisition time 7:34 m<strong>in</strong>, matrix 224512<br />
giv<strong>in</strong>g a pixel size <strong>of</strong> 0.6x0.4 mm, <strong>in</strong> order to differentiate<br />
between fat <strong>in</strong> <strong>the</strong> <strong>ligaments</strong> <strong>and</strong> high-signal<br />
alterations caused by edema or fi brosis. All exam<strong>in</strong>ations<br />
were assessed by three <strong>in</strong>dependent neuroradiologists<br />
bl<strong>in</strong>ded to <strong>the</strong> classifi cation by <strong>the</strong>ir colleagues on<br />
a 4-po<strong>in</strong>t scale rang<strong>in</strong>g from 0 (normal) to 3 (maximal<br />
pathologic change) (11–14).<br />
The classifi cation was defi ned as follows. For alar<br />
<strong>ligaments</strong>, based on maximal cross-section <strong>in</strong>volvement<br />
<strong>in</strong> sagittal images (11): grade 0, low signal throughout<br />
entire cross-section (Fig. 1); grade 1, high signal <strong>in</strong> 1/3<br />
or less <strong>of</strong> cross-section; grade 2, high signal <strong>in</strong> 1/3–2/3<br />
<strong>of</strong> cross-section; grade 3, high signal <strong>in</strong> 2/3 or more <strong>of</strong><br />
cross-section (Fig. 2). For <strong>the</strong> transverse ligament (13):<br />
grade 0, ligament with low signal <strong>in</strong>tensity, appear<strong>in</strong>g<br />
dark; grade 1, slightly <strong>in</strong>creased signal, well defi ned or<br />
slightly diffuse marg<strong>in</strong>s; grade 2, moderately <strong>in</strong>creased<br />
signal <strong>in</strong>tensity with or without diffuse marg<strong>in</strong>s (Fig. 3);<br />
grade 3, markedly <strong>in</strong>creased signal <strong>in</strong>tensity, identical<br />
to that <strong>of</strong> muscle tissue or higher, <strong>and</strong> ill-defi ned marg<strong>in</strong>s.<br />
For <strong>the</strong> tectorial membrane (12): grade 0, a membrane/dura<br />
mater complex thicker than <strong>the</strong> dura mater<br />
alone <strong>in</strong> all sagittal sections (Fig. 4); grade 1, only dura<br />
Acta Radiol 2010 (2)<br />
mater left <strong>in</strong> 1/3 <strong>of</strong> transverse width 1 ; grade 2, only<br />
dura mater left <strong>in</strong> 1/3 to 2/3 <strong>of</strong> transverse width; grade<br />
3, only dura mater left <strong>in</strong> 2/3 <strong>of</strong> transverse width. For<br />
<strong>the</strong> posterior atlantooccipital membrane (12): grade 0,<br />
smooth <strong>and</strong> well-defi ned membrane/dura mater complex;<br />
grade 1, th<strong>in</strong>n<strong>in</strong>g, m<strong>in</strong>or discont<strong>in</strong>uity, or a dural<br />
hump <strong>in</strong> 1/3 <strong>of</strong> transverse width (v. 5); grade 2, as<br />
grade 1, affect<strong>in</strong>g 1/3–2/3 <strong>of</strong> transverse width 1 ; grade<br />
3, discont<strong>in</strong>uity with or without a dural fl ap <strong>in</strong> 2/3 <strong>of</strong><br />
transverse width.<br />
The alar <strong>ligaments</strong> <strong>and</strong> <strong>the</strong> tectorial <strong>and</strong> posterior<br />
atlantooccipital <strong>membranes</strong> were assessed both with<br />
<strong>and</strong> without fat suppression. In <strong>the</strong> transverse <strong>ligaments</strong>,<br />
however, <strong>the</strong> assessment accord<strong>in</strong>g to <strong>the</strong> current<br />
classifi cation (13) is to a greater extent based on<br />
coronal <strong>and</strong> axial images. Therefore, this ligament was<br />
classifi ed based on images without fat suppression<br />
only.<br />
For <strong>the</strong> alar <strong>and</strong> transverse <strong>ligaments</strong>, <strong>in</strong>terobserver<br />
variability was tested with <strong>the</strong> kappa value. In <strong>the</strong> tectorial<br />
<strong>and</strong> posterior atlantooccipital <strong>membranes</strong>, however,<br />
<strong>the</strong> frequency <strong>of</strong> abnormal fi nd<strong>in</strong>gs was too low for a<br />
valid kappa-value calculation. Differences between<br />
patients <strong>and</strong> control subjects were calculated with <strong>the</strong><br />
chi-square test (17). In cases where one <strong>of</strong> <strong>the</strong> expected<br />
values was below 5, <strong>the</strong> Fisher exact test was used (17).<br />
As <strong>the</strong> fi nal result, <strong>the</strong> assessment by one <strong>of</strong> <strong>the</strong> authors<br />
(Ø.G.) was chosen (Table 1).<br />
Results<br />
Interobserver agreement was poor among all observers<br />
both for <strong>the</strong> alar <strong>ligaments</strong> (kappa: 0.05–0.40) <strong>and</strong><br />
for <strong>the</strong> transverse ligament (kappa: 0.19–0.20). The<br />
classifi cation <strong>of</strong> <strong>the</strong> <strong>ligaments</strong> <strong>and</strong> <strong>membranes</strong> <strong>of</strong> <strong>the</strong><br />
craniocervical junction <strong>in</strong> WAD patients <strong>and</strong> control<br />
subjects appears <strong>in</strong> Table 1.<br />
1 The transverse width was estimated by number<strong>in</strong>g all images <strong>in</strong> which<br />
<strong>the</strong> <strong>membranes</strong> could be appreciated.