

Nosocomiale Infecties in België, deel II: Impact op Mortaliteit ... - KCE
Nosocomiale Infecties in België, deel II: Impact op Mortaliteit ... - KCE
Nosocomiale Infecties in België, deel II: Impact op Mortaliteit ... - KCE

You also want an ePaper? Increase the reach of your titles
YUMPU automatically turns print PDFs into web optimized ePapers that Google loves.
<strong>KCE</strong> reports 102 Nosocomial Infections – Mortality and Costs 29<br />
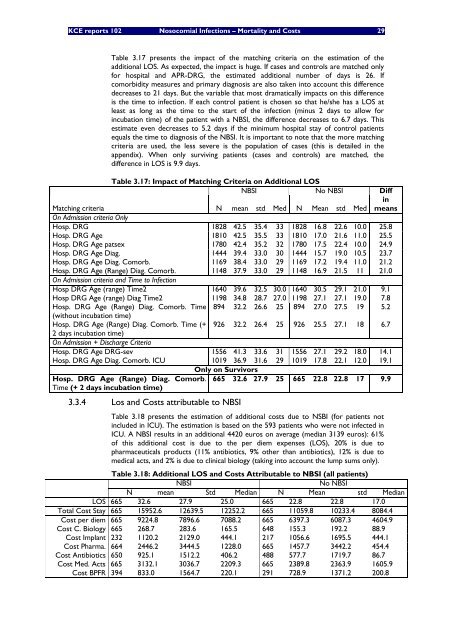
Table 3.17 presents the impact of the match<strong>in</strong>g criteria on the estimation of the<br />
additional LOS. As expected, the impact is huge. If cases and controls are matched only<br />
for hospital and APR-DRG, the estimated additional number of days is 26. If<br />
comorbidity measures and primary diagnosis are also taken <strong>in</strong>to account this difference<br />
decreases to 21 days. But the variable that most dramatically impacts on this difference<br />
is the time to <strong>in</strong>fection. If each control patient is chosen so that he/she has a LOS at<br />
least as long as the time to the start of the <strong>in</strong>fection (m<strong>in</strong>us 2 days to allow for<br />
<strong>in</strong>cubation time) of the patient with a NBSI, the difference decreases to 6.7 days. This<br />
estimate even decreases to 5.2 days if the m<strong>in</strong>imum hospital stay of control patients<br />
equals the time to diagnosis of the NBSI. It is important to note that the more match<strong>in</strong>g<br />
criteria are used, the less severe is the p<strong>op</strong>ulation of cases (this is detailed <strong>in</strong> the<br />
appendix). When only surviv<strong>in</strong>g patients (cases and controls) are matched, the<br />
difference <strong>in</strong> LOS is 9.9 days.<br />
Table 3.17: <strong>Impact</strong> of Match<strong>in</strong>g Criteria on Additional LOS<br />
NBSI No NBSI Diff<br />
<strong>in</strong><br />
Match<strong>in</strong>g criteria<br />
On Admission criteria Only<br />
N mean std Med N Mean std Med means<br />
Hosp. DRG 1828 42.5 35.4 33 1828 16.8 22.6 10.0 25.8<br />
Hosp. DRG Age 1810 42.5 35.5 33 1810 17.0 21.6 11.0 25.5<br />
Hosp. DRG Age patsex 1780 42.4 35.2 32 1780 17.5 22.4 10.0 24.9<br />
Hosp. DRG Age Diag. 1444 39.4 33.0 30 1444 15.7 19.0 10.5 23.7<br />
Hosp. DRG Age Diag. Comorb. 1169 38.4 33.0 29 1169 17.2 19.4 11.0 21.2<br />
Hosp. DRG Age (Range) Diag. Comorb.<br />
On Admission criteria and Time to Infection<br />
1148 37.9 33.0 29 1148 16.9 21.5 11 21.0<br />
Hosp DRG Age (range) Time2 1640 39.6 32.5 30.0 1640 30.5 29.1 21.0 9.1<br />
Hosp DRG Age (range) Diag Time2 1198 34.8 28.7 27.0 1198 27.1 27.1 19.0 7.8<br />
Hosp. DRG Age (Range) Diag. Comorb. Time 894<br />
(without <strong>in</strong>cubation time)<br />
32.2 26.6 25 894 27.0 27.5 19 5.2<br />
Hosp. DRG Age (Range) Diag. Comorb. Time (+<br />
2 days <strong>in</strong>cubation time)<br />
On Admission + Discharge Criteria<br />
926 32.2 26.4 25 926 25.5 27.1 18 6.7<br />
Hosp. DRG Age DRG-sev 1556 41.3 33.6 31 1556 27.1 29.2 18.0 14.1<br />
Hosp. DRG Age Diag. Comorb. ICU 1019 36.9 31.6 29 1019 17.8 22.1 12.0 19.1<br />
Only on Survivors<br />
Hosp. DRG Age (Range) Diag. Comorb.<br />
Time (+ 2 days <strong>in</strong>cubation time)<br />
665 32.6 27.9 25 665 22.8 22.8 17 9.9<br />
3.3.4 Los and Costs attributable to NBSI<br />
Table 3.18 presents the estimation of additional costs due to NSBI (for patients not<br />
<strong>in</strong>cluded <strong>in</strong> ICU). The estimation is based on the 593 patients who were not <strong>in</strong>fected <strong>in</strong><br />
ICU. A NBSI results <strong>in</strong> an additional 4420 euros on average (median 3139 euros): 61%<br />
of this additional cost is due to the per diem expenses (LOS), 20% is due to<br />
pharmaceuticals products (11% antibiotics, 9% other than antibiotics), 12% is due to<br />
medical acts, and 2% is due to cl<strong>in</strong>ical biology (tak<strong>in</strong>g <strong>in</strong>to account the lump sums only).<br />
Table 3.18: Additional LOS and Costs Attributable to NBSI (all patients)<br />
NBSI No NBSI<br />
N mean Std Median N Mean std Median<br />
LOS 665 32.6 27.9 25.0 665 22.8 22.8 17.0<br />
Total Cost Stay 665 15952.6 12639.5 12252.2 665 11059.8 10233.4 8084.4<br />
Cost per diem 665 9224.8 7896.6 7088.2 665 6397.3 6087.3 4604.9<br />
Cost C. Biology 665 268.7 283.6 165.5 648 155.3 192.2 88.9<br />
Cost Implant 232 1120.2 2129.0 444.1 217 1056.6 1695.5 444.1<br />
Cost Pharma. 664 2446.2 3444.5 1228.0 665 1457.7 3442.2 454.4<br />
Cost Antibiotics 650 925.1 1512.2 406.2 488 577.7 1719.7 86.7<br />
Cost Med. Acts 665 3132.1 3036.7 2209.3 665 2389.8 2363.9 1605.9<br />
Cost BPFR 394 833.0 1564.7 220.1 291 728.9 1371.2 200.8


