Communication and Industrial Accidents - SOM Research Reports
Communication and Industrial Accidents - SOM Research Reports
Communication and Industrial Accidents - SOM Research Reports

Create successful ePaper yourself
Turn your PDF publications into a flip-book with our unique Google optimized e-Paper software.
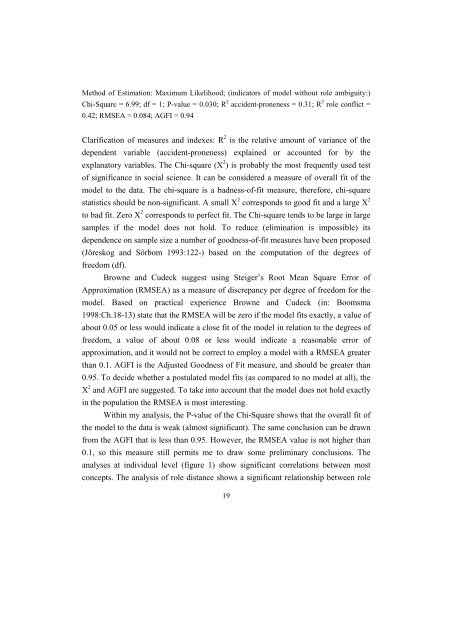
Method of Estimation: Maximum Likelihood; (indicators of model without role ambiguity:)<br />
Chi-Square = 6.99; df = 1; P-value = 0.030; R 2 accident-proneness = 0.31; R 2 role conflict =<br />
0.42; RMSEA = 0.084; AGFI = 0.94<br />
Clarification of measures <strong>and</strong> indexes: R 2 is the relative amount of variance of the<br />
dependent variable (accident-proneness) explained or accounted for by the<br />
explanatory variables. The Chi-square (X 2 ) is probably the most frequently used test<br />
of significance in social science. It can be considered a measure of overall fit of the<br />
model to the data. The chi-square is a badness-of-fit measure, therefore, chi-square<br />
statistics should be non-significant. A small X 2 corresponds to good fit <strong>and</strong> a large X 2<br />
to bad fit. Zero X 2 corresponds to perfect fit. The Chi-square tends to be large in large<br />
samples if the model does not hold. To reduce (elimination is impossible) its<br />
dependence on sample size a number of goodness-of-fit measures have been proposed<br />
(Jöreskog <strong>and</strong> Sörbom 1993:122-) based on the computation of the degrees of<br />
freedom (df).<br />
Browne <strong>and</strong> Cudeck suggest using Steiger’s Root Mean Square Error of<br />
Approximation (RMSEA) as a measure of discrepancy per degree of freedom for the<br />
model. Based on practical experience Browne <strong>and</strong> Cudeck (in: Boomsma<br />
1998:Ch.18-13) state that the RMSEA will be zero if the model fits exactly, a value of<br />
about 0.05 or less would indicate a close fit of the model in relation to the degrees of<br />
freedom, a value of about 0.08 or less would indicate a reasonable error of<br />
approximation, <strong>and</strong> it would not be correct to employ a model with a RMSEA greater<br />
than 0.1. AGFI is the Adjusted Goodness of Fit measure, <strong>and</strong> should be greater than<br />
0.95. To decide whether a postulated model fits (as compared to no model at all), the<br />
X 2 <strong>and</strong> AGFI are suggested. To take into account that the model does not hold exactly<br />
in the population the RMSEA is most interesting.<br />
Within my analysis, the P-value of the Chi-Square shows that the overall fit of<br />
the model to the data is weak (almost significant). The same conclusion can be drawn<br />
from the AGFI that is less than 0.95. However, the RMSEA value is not higher than<br />
0.1, so this measure still permits me to draw some preliminary conclusions. The<br />
analyses at individual level (figure 1) show significant correlations between most<br />
concepts. The analysis of role distance shows a significant relationship between role<br />
19