Goodwin, P. and Lyons, G. (2009) Public attitudes to transport ...
Goodwin, P. and Lyons, G. (2009) Public attitudes to transport ...
Goodwin, P. and Lyons, G. (2009) Public attitudes to transport ...

You also want an ePaper? Increase the reach of your titles
YUMPU automatically turns print PDFs into web optimized ePapers that Google loves.
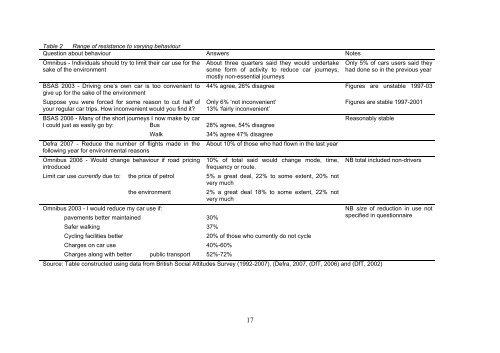
Table 2 Range of resistance <strong>to</strong> varying behaviour<br />
Question about behaviour Answers Notes<br />
Omnibus - Individuals should try <strong>to</strong> limit their car use for the<br />
sake of the environment<br />
BSAS 2003 - Driving one’s own car is <strong>to</strong>o convenient <strong>to</strong><br />
give up for the sake of the environment<br />
Suppose you were forced for some reason <strong>to</strong> cut half of<br />
your regular car trips. How inconvenient would you find it?<br />
BSAS 2006 - Many of the short journeys I now make by car<br />
I could just as easily go by: Bus<br />
Walk<br />
Defra 2007 - Reduce the number of flights made in the<br />
following year for environmental reasons<br />
Omnibus 2006 - Would change behaviour if road pricing<br />
introduced<br />
Limit car use currently due <strong>to</strong>: the price of petrol<br />
the environment<br />
About three quarters said they would undertake<br />
some form of activity <strong>to</strong> reduce car journeys,<br />
mostly non-essential journeys<br />
44% agree, 26% disagree<br />
Only 6% ‘not inconvenient’<br />
13% ‘fairly inconvenient’<br />
28% agree, 54% disagree<br />
34% agree 47% disagree<br />
About 10% of those who had flown in the last year<br />
10% of <strong>to</strong>tal said would change mode, time,<br />
frequency or route.<br />
5% a great deal, 22% <strong>to</strong> some extent, 20% not<br />
very much<br />
2% a great deal 18% <strong>to</strong> some extent, 22% not<br />
very much<br />
17<br />
Only 5% of cars users said they<br />
had done so in the previous year<br />
Figures are unstable 1997-03<br />
Figures are stable 1997-2001<br />
Reasonably stable<br />
NB <strong>to</strong>tal included non-drivers<br />
Omnibus 2003 - I would reduce my car use if:<br />
NB size of reduction in use not<br />
pavements better maintained<br />
30%<br />
specified in questionnaire<br />
Safer walking<br />
37%<br />
Cycling facilities better<br />
20% of those who currently do not cycle<br />
Charges on car use<br />
40%-60%<br />
Charges along with better public <strong>transport</strong> 52%-72%<br />
Source: Table constructed using data from British Social Attitudes Survey (1992-2007), (Defra, 2007, (DfT, 2006) <strong>and</strong> (DfT, 2002)