Item.pdf - University of Oxford
Item.pdf - University of Oxford
Item.pdf - University of Oxford

Create successful ePaper yourself
Turn your PDF publications into a flip-book with our unique Google optimized e-Paper software.
12<br />
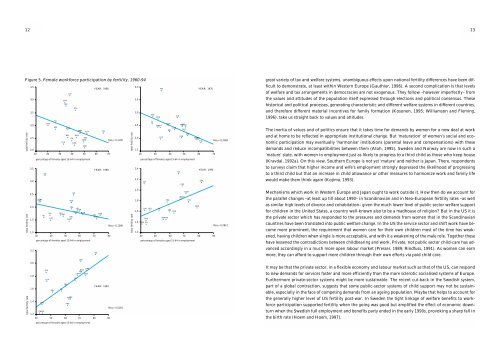
Figure 5. Female workforce participation by fertility, 1960-94<br />
total fertility rate<br />
total fertility rate<br />
total fertility rate<br />
4,5<br />
4,0<br />
3,5<br />
3,0<br />
2,5<br />
2,0<br />
3,5<br />
3,0<br />
2,5<br />
2,0<br />
1,5<br />
10<br />
1,0<br />
30<br />
2,2<br />
2,0<br />
1,8<br />
1,6<br />
1,4<br />
1,2<br />
POR<br />
20<br />
NL<br />
ESP<br />
30<br />
CAN<br />
IRE<br />
ICE<br />
percentage <strong>of</strong> females aged 15-64 in employment<br />
40<br />
USA<br />
50<br />
YEAR: 1960<br />
NOR<br />
FRA UK<br />
AUT<br />
FIN<br />
BEL DEN<br />
ITA<br />
SWI<br />
FRG<br />
LUX<br />
GRE<br />
SWE<br />
percentage <strong>of</strong> females aged 15-64 in employment<br />
40<br />
ESP GRE<br />
GRE<br />
IRE<br />
NL<br />
ITAESP<br />
IRE<br />
LUX<br />
ITA<br />
LUX<br />
40<br />
BEL<br />
50<br />
FRA<br />
UK<br />
USA<br />
CAN<br />
BEL NOR<br />
AUT<br />
SWI<br />
FRG<br />
NL<br />
50<br />
FRA<br />
POR<br />
AUT<br />
POR<br />
ICE<br />
percentage <strong>of</strong> females aged 15-64 in employment<br />
60<br />
FRG<br />
60<br />
USA<br />
SWE<br />
NOR<br />
FIN<br />
CAN DEN<br />
UK<br />
70<br />
60<br />
YEAR: 1980<br />
SWE<br />
FIN<br />
DEN<br />
70<br />
Rsq = 0,1105<br />
70<br />
YEAR: 1994<br />
80<br />
ICE<br />
Rsq = 0,1286<br />
80<br />
Rsq = 0,5165<br />
90<br />
total fertility rate<br />
total fertility rate<br />
4,0<br />
3,5<br />
3,0<br />
2,5<br />
2,0<br />
1,5<br />
2,4<br />
2,2<br />
2,0<br />
1,8<br />
1,6<br />
1,4<br />
1,2<br />
20<br />
ESP<br />
POR<br />
NL<br />
GREITA<br />
30<br />
IRE<br />
LUX<br />
NOR<br />
CAN<br />
BEL<br />
percentage <strong>of</strong> females aged 15-64 in employment<br />
ESP ITA<br />
40<br />
IRE<br />
LUX BEL<br />
GRE<br />
50<br />
NL<br />
AUTFRG<br />
40<br />
SWI<br />
POR<br />
ICE<br />
FRA USAUK FRG<br />
AUT<br />
50<br />
SWI<br />
percentage <strong>of</strong> females aged 15-64 in employment<br />
60<br />
ICE<br />
USA<br />
UKCAN<br />
70<br />
NOR<br />
FRA FIN<br />
DEN SWE<br />
YEAR: 1970<br />
60<br />
DEN<br />
FIN<br />
YEAR: 1990<br />
80<br />
SWE<br />
Rsq = 0,3169<br />
70<br />
Rsq = 0,2812<br />
90<br />
great variety <strong>of</strong> tax and welfare systems, unambiguous effects upon national fertility differences have been difficult<br />
to demonstrate, at least within Western Europe (Gauthier, 1996). A second complication is that levels<br />
<strong>of</strong> welfare and tax arrangements in democracies are not exogenous. They follow –however imperfectly– from<br />
the values and attitudes <strong>of</strong> the population itself expressed through elections and political consensus. These<br />
historical and political processes, generating characteristic and different welfare systems in different countries,<br />
and therefore different material incentives for family formation (Kosonen, 1995; Williamson and Fleming,<br />
1996), take us straight back to values and attitudes.<br />
The inertia <strong>of</strong> values and <strong>of</strong> politics ensure that it takes time for demands by women for a new deal at work<br />
and at home to be reflected in appropriate institutional change. But ‘maturation’ <strong>of</strong> women’s social and economic<br />
participation may eventually ‘harmonise’ institutions (parental leave and compensations) with these<br />
demands and reduce incompatibilities between them (Atoh, 1995). Sweden and Norway are now in such a<br />
‘mature’ state, with women in employment just as likely to progress to a third child as those who keep house<br />
(Kravdal, 1992a). On this view, Southern Europe is not yet ‘mature’ and neither is Japan. There, respondents<br />
to surveys claim that higher income and wife’s employment strongly depressed the likelihood <strong>of</strong> progressing<br />
to a third child but that an increase in child allowance or other measures to harmonize work and family life<br />
would make them think again (Kojima, 1993).<br />
Mechanisms which work in Western Europe and Japan ought to work outside it. How then do we account for<br />
the parallel changes –at least up till about 1990– in Scandinavian and in Neo-European fertility rates –as well<br />
as similar high levels <strong>of</strong> divorce and cohabitation– given the much lower level <strong>of</strong> public sector welfare support<br />
for children in the United States, a country well-known also to be a madhouse <strong>of</strong> religion? But in the US it is<br />
the private sector which has responded to the pressures and demands from women that in the Scandinavian<br />
countries have been translated into public welfare change. In the US the service sector and shift work have become<br />
more prominent, the requirement that women care for their own children most <strong>of</strong> the time has weakened,<br />
having children when single is more acceptable, and with it a weakening <strong>of</strong> the male role. Together these<br />
have lessened the contradictions between childbearing and work. Private, not public sector child-care has advanced<br />
accordingly in a much more open labour market (Presser, 1989; Rindfuss, 1991). As women can earn<br />
more, they can afford to support more children through their own efforts via paid child care.<br />
It may be that the private sector, in a flexible economy and labour market such as that <strong>of</strong> the US, can respond<br />
to new demands for services faster and more efficiently than the more sclerotic socialised systems <strong>of</strong> Europe.<br />
Furthermore private-sector systems might be more sustainable. The recent cut-back in the Swedish system,<br />
part <strong>of</strong> a global contraction, suggests that some public-sector systems <strong>of</strong> child support may not be sustainable,<br />
especially in the face <strong>of</strong> competing demands from an ageing population. Maybe that helps to account for<br />
the generally higher level <strong>of</strong> US fertility post-war. In Sweden the tight linkage <strong>of</strong> welfare benefits to workforce<br />
participation supported fertility when the going was good but amplified the effect <strong>of</strong> economic downturn<br />
when the Swedish full employment and benefits party ended in the early 1990s, provoking a sharp fall in<br />
the birth rate (Hoem and Hoem, 1997).<br />
13