Ten Tribes Reclaiming, Stewarding, and Restoring Ancestral Lands
Ten Tribes Reclaiming, Stewarding, and Restoring Ancestral Lands
Ten Tribes Reclaiming, Stewarding, and Restoring Ancestral Lands

You also want an ePaper? Increase the reach of your titles
YUMPU automatically turns print PDFs into web optimized ePapers that Google loves.
delineated by the pin flags) were used<br />
for the radial transect measurements,<br />
allowing for a direct comparison of the<br />
two methods. Control areas for each<br />
site (adjacent areas with no observable<br />
disturbance) were selected according<br />
to Marion (1991) <strong>and</strong> assessed for<br />
percent vegetation cover via both<br />
ocular estimation <strong>and</strong> image analysis<br />
to allow for the calculation of estimated<br />
vegetation cover loss (mid-point<br />
value of percent cover in control<br />
plots—mid-point value of percent<br />
cover in campsites).<br />
Findings<br />
Analysis of known cover templates<br />
indicate that percent error (variation<br />
between measured <strong>and</strong> known cover)<br />
diminished as cover increased, from a<br />
high of 9% at 1% cover to a low of 3%<br />
at 70% cover. Most of the measurements<br />
in the mid-range of the scale<br />
(where many backcountry campsites<br />
would fall) were in the 4% range.<br />
Image analysis of site areas of known<br />
sizes demonstrated accuracy in the<br />
range of 4.4% to 6.3%. In both of the<br />
above trials three images were analyzed<br />
independently <strong>and</strong> no apparent pattern<br />
of over- or underestimation was<br />
observed.<br />
For both percent vegetation cover<br />
estimates <strong>and</strong> size measurements significant<br />
differences were observed in<br />
comparisons of st<strong>and</strong>ard techniques<br />
<strong>and</strong> image analysis. In comparisons of<br />
all sites (N = 36) paired T-tests showed<br />
significant differences in percent cover<br />
(P = .046) <strong>and</strong> campsite size (P =<br />
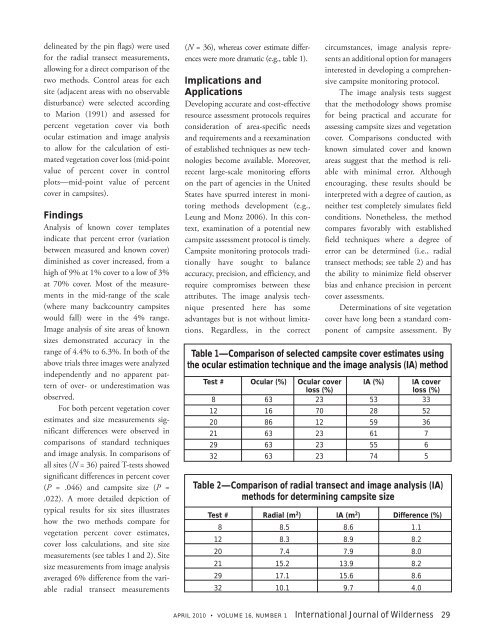
.022). A more detailed depiction of<br />
typical results for six sites illustrates<br />
how the two methods compare for<br />
vegetation percent cover estimates,<br />
cover loss calculations, <strong>and</strong> site size<br />
measurements (see tables 1 <strong>and</strong> 2). Site<br />
size measurements from image analysis<br />
averaged 6% difference from the variable<br />
radial transect measurements<br />
(N = 36), whereas cover estimate differences<br />
were more dramatic (e.g., table 1).<br />
Implications <strong>and</strong><br />
Applications<br />
Developing accurate <strong>and</strong> cost-effective<br />
resource assessment protocols requires<br />
consideration of area-specific needs<br />
<strong>and</strong> requirements <strong>and</strong> a reexamination<br />
of established techniques as new technologies<br />
become available. Moreover,<br />
recent large-scale monitoring efforts<br />
on the part of agencies in the United<br />
States have spurred interest in monitoring<br />
methods development (e.g.,<br />
Leung <strong>and</strong> Monz 2006). In this context,<br />
examination of a potential new<br />
campsite assessment protocol is timely.<br />
Campsite monitoring protocols traditionally<br />
have sought to balance<br />
accuracy, precision, <strong>and</strong> efficiency, <strong>and</strong><br />
require compromises between these<br />
attributes. The image analysis technique<br />
presented here has some<br />
advantages but is not without limitations.<br />
Regardless, in the correct<br />
circumstances, image analysis represents<br />
an additional option for managers<br />
interested in developing a comprehensive<br />
campsite monitoring protocol.<br />
The image analysis tests suggest<br />
that the methodology shows promise<br />
for being practical <strong>and</strong> accurate for<br />
assessing campsite sizes <strong>and</strong> vegetation<br />
cover. Comparisons conducted with<br />
known simulated cover <strong>and</strong> known<br />
areas suggest that the method is reliable<br />
with minimal error. Although<br />
encouraging, these results should be<br />
interpreted with a degree of caution, as<br />
neither test completely simulates field<br />
conditions. Nonetheless, the method<br />
compares favorably with established<br />
field techniques where a degree of<br />
error can be determined (i.e., radial<br />
transect methods; see table 2) <strong>and</strong> has<br />
the ability to minimize field observer<br />
bias <strong>and</strong> enhance precision in percent<br />
cover assessments.<br />
Determinations of site vegetation<br />
cover have long been a st<strong>and</strong>ard component<br />
of campsite assessment. By<br />
Table 1—Comparison of selected campsite cover estimates using<br />
the ocular estimation technique <strong>and</strong> the image analysis (IA) method<br />
Test # Ocular (%) Ocular cover IA (%) IA cover<br />
loss (%) loss (%)<br />
8 63 23 53 33<br />
12 16 70 28 52<br />
20 86 12 59 36<br />
21 63 23 61 7<br />
29 63 23 55 6<br />
32 63 23 74 5<br />
Table 2—Comparison of radial transect <strong>and</strong> image analysis (IA)<br />
methods for determining campsite size<br />
Test # Radial (m2 ) IA (m2 ) Difference (%)<br />
8 8.5 8.6 1.1<br />
12 8.3 8.9 8.2<br />
20 7.4 7.9 8.0<br />
21 15.2 13.9 8.2<br />
29 17.1 15.6 8.6<br />
32 10.1 9.7 4.0<br />
APRIL 2010 VOLUME 16, NUMBER 1 International Journal of Wilderness 29