Small World Overlay Networks - SNAP
Small World Overlay Networks - SNAP
Small World Overlay Networks - SNAP

You also want an ePaper? Increase the reach of your titles
YUMPU automatically turns print PDFs into web optimized ePapers that Google loves.
Kamil Pawlowski CS224w<br />
the Internet. 2304 routers are picked at random from the largest SCC in the graph (190K<br />
nodes) to be endpoints behind which a symphony node lives. Nodes are picked without<br />
repetition. While it may be the case that multiple Symphony nodes could live behind the<br />
same router, for the purposes of this experiment, they are assumed to be treated as just<br />
one node.<br />
Expected Results<br />
This experiment was conceived to see if Symphony in particular, and small world graphs<br />
in general had potential as real world systems. This having been said it also aimed to<br />
verify several thesis:<br />
Carefully constructed rings perform better than organically grown (evolved) rings.<br />
Random Graphs perform worse than trees.<br />
The average path length in the underlying network is an accurate heuristic for<br />
how much small world path cost increases when the underlying path length is<br />
added.<br />
It was not clear when the experiment was conceived if the Internet graph would perform<br />
more akin to a tree structure or a random graph.<br />
Results<br />
Clustering<br />
Coefficient<br />
Ave<br />
Path<br />
Btwn<br />
Base<br />
Nodes<br />
Ave<br />
Path<br />
Btwn<br />
Lattice<br />
Nodes<br />
Ave<br />
BFS<br />
Path<br />
on<br />
Ring<br />
Ave<br />
Symp<br />
Path<br />
on<br />
Ring<br />
Ave<br />
Path<br />
Btwn<br />
Ring<br />
Nodes<br />
in Base<br />
Graph<br />
Ave<br />
Total<br />
Path<br />
Length<br />
(BFS)<br />
Ave<br />
Total<br />
Path<br />
Length<br />
(Symp)<br />
<strong>Small</strong>DC (O) 0.000000 4.4 576.0 6.0 17.8 5.0 22.0 50.6<br />
<strong>Small</strong>DC (R) 0.000000 4.4 576.0 6.0 17.8 5.0 37.0 100.6<br />
LargeDC (O) 0.000000 2.6 576.0 6.0 17.6 3.0 18.8 44.8<br />
LargeDC (R) 0.000000 3.0 576.0 6.0 17.6 3.0 26.8 71.8<br />
Rnd Grph (O) 0.000326 9.8 576.0 6.0 18.0 10.0 42.8 87.6<br />
Rnd Grph (R) 0.000663 10.2 576.0 6.0 17.6 9.8 74.2 201.0<br />
Rnd Lg Grph<br />
(O) 0.000028 43.0 576.0 6.0 17.6 42.8 117.2 189.4<br />
Rnd Lg Grph<br />
(R) 0.000035 39.6 576.0 6.0 17.8 38.4 278.0 721.8<br />
Internet (O) 0.157413 6.0 576.0 6.0 17.8 6.0 39.4 99.2<br />
Internet (R) 0.157413 6.0 576.0 6.0 17.6 6.0 48.0 126.0<br />
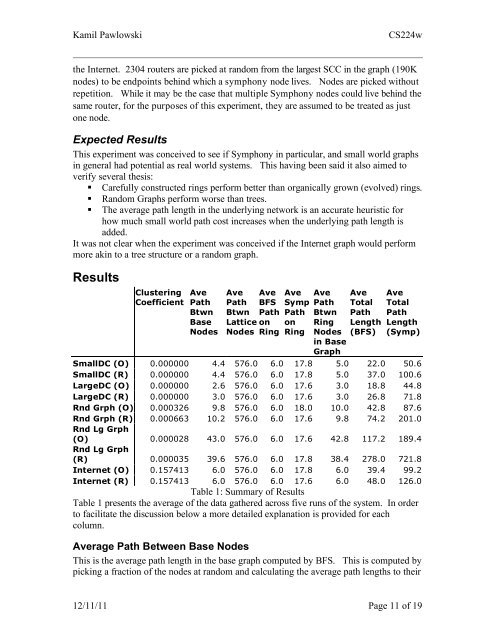
Table 1: Summary of Results<br />
Table 1 presents the average of the data gathered across five runs of the system. In order<br />
to facilitate the discussion below a more detailed explanation is provided for each<br />
column.<br />
Average Path Between Base Nodes<br />
This is the average path length in the base graph computed by BFS. This is computed by<br />
picking a fraction of the nodes at random and calculating the average path lengths to their<br />
12/11/11 Page 11 of 19