Analysis of a ferric leghemoglobin reductase from cowpea (Vigna ...
Analysis of a ferric leghemoglobin reductase from cowpea (Vigna ...
Analysis of a ferric leghemoglobin reductase from cowpea (Vigna ...

Create successful ePaper yourself
Turn your PDF publications into a flip-book with our unique Google optimized e-Paper software.
164<br />
though approximately 50% <strong>of</strong> the total activity<br />
was lost. A 40-fold decrease in the ratio <strong>of</strong> diaphorase<br />
to FLbR activity (Table 1) indicated that<br />
many <strong>of</strong> the other contaminating diaphorases were<br />
removed at this step. On the FPLC anion exchange<br />
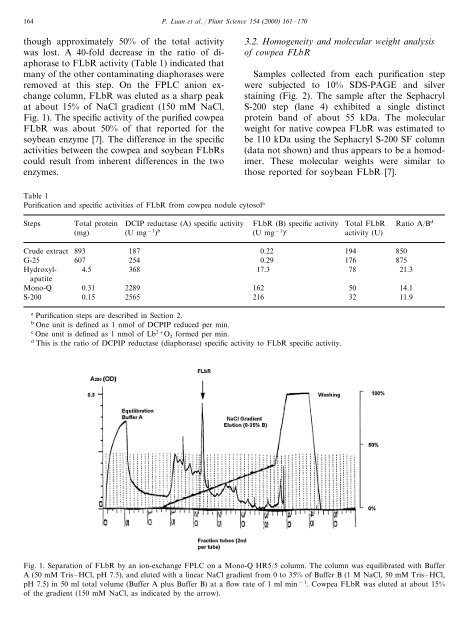
column, FLbR was eluted as a sharp peak<br />
at about 15% <strong>of</strong> NaCl gradient (150 mM NaCl,<br />
Fig. 1). The specific activity <strong>of</strong> the purified <strong>cowpea</strong><br />
FLbR was about 50% <strong>of</strong> that reported for the<br />
soybean enzyme [7]. The difference in the specific<br />
activities between the <strong>cowpea</strong> and soybean FLbRs<br />
could result <strong>from</strong> inherent differences in the two<br />
enzymes.<br />
P. Luan et al. / Plant Science 154 (2000) 161–170<br />
Table 1<br />
Purification and specific activities <strong>of</strong> FLbR <strong>from</strong> <strong>cowpea</strong> nodule cytosol a<br />
3.2. Homogeneity and molecular weight analysis<br />
<strong>of</strong> <strong>cowpea</strong> FLbR<br />
Samples collected <strong>from</strong> each purification step<br />
were subjected to 10% SDS-PAGE and silver<br />
staining (Fig. 2). The sample after the Sephacryl<br />
S-200 step (lane 4) exhibited a single distinct<br />
protein band <strong>of</strong> about 55 kDa. The molecular<br />
weight for native <strong>cowpea</strong> FLbR was estimated to<br />
be 110 kDa using the Sephacryl S-200 SF column<br />
(data not shown) and thus appears to be a homodimer.<br />
These molecular weights were similar to<br />
those reported for soybean FLbR [7].<br />
Steps Total protein DCIP <strong>reductase</strong> (A) specific activity<br />
Ratio A/Bd FLbR (B) specific activity Total FLbR<br />
(mg) (U mg−1 ) c<br />
(U mg−1 ) b activity (U)<br />
Crude extract 893 187 0.22 194<br />
850<br />
G-25 607 254 0.29 176 875<br />
Hydroxylapatite<br />
4.5 368<br />
17.3<br />
78<br />
21.3<br />
Mono-Q 0.31 2289 162 50 14.1<br />
S-200 0.15 2565<br />
216 32 11.9<br />
a Purification steps are described in Section 2.<br />
b One unit is defined as 1 nmol <strong>of</strong> DCPIP reduced per min.<br />
c One unit is defined as 1 nmol <strong>of</strong> Lb 2+ O2 formed per min.<br />
d This is the ratio <strong>of</strong> DCPIP <strong>reductase</strong> (diaphorase) specific activity to FLbR specific activity.<br />
Fig. 1. Separation <strong>of</strong> FLbR by an ion-exchange FPLC on a Mono-Q HR5/5 column. The column was equilibrated with Buffer<br />
A (50 mM Tris–HCl, pH 7.5), and eluted with a linear NaCl gradient <strong>from</strong> 0 to 35% <strong>of</strong> Buffer B (1 M NaCl, 50 mM Tris–HCl,<br />
pH 7.5) in 50 ml total volume (Buffer A plus Buffer B) at a flow rate <strong>of</strong> 1 ml min −1 . Cowpea FLbR was eluted at about 15%<br />
<strong>of</strong> the gradient (150 mM NaCl, as indicated by the arrow).