AmChamNews - American Chamber of Commerce in the Netherlands
AmChamNews - American Chamber of Commerce in the Netherlands
AmChamNews - American Chamber of Commerce in the Netherlands
Create successful ePaper yourself
Turn your PDF publications into a flip-book with our unique Google optimized e-Paper software.
50<br />
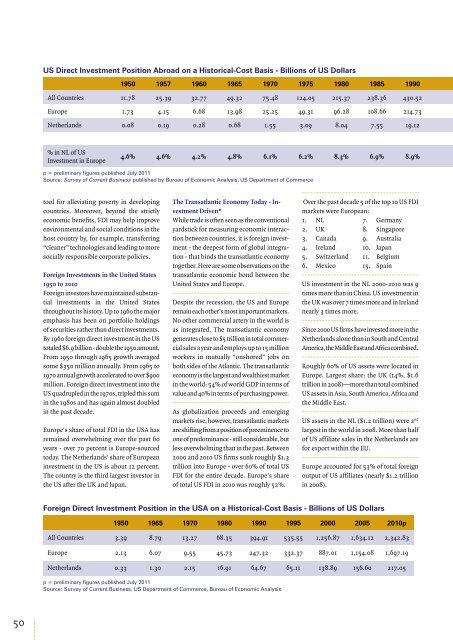
US Direct Investment Position Abroad on a Historical-Cost Basis - Billions <strong>of</strong> US Dollars<br />
tool for alleviat<strong>in</strong>g poverty <strong>in</strong> develop<strong>in</strong>g<br />
countries. Moreover, beyond <strong>the</strong> strictly<br />
economic benefits, FDI may help improve<br />
environmental and social conditions <strong>in</strong> <strong>the</strong><br />
host country by, for example, transferr<strong>in</strong>g<br />
“cleaner” technologies and lead<strong>in</strong>g to more<br />
socially responsible corporate policies.<br />
Foreign Investments <strong>in</strong> <strong>the</strong> United States<br />
1950 to 2010<br />
Foreign <strong>in</strong>vestors have ma<strong>in</strong>ta<strong>in</strong>ed substantial<br />
<strong>in</strong>vestments <strong>in</strong> <strong>the</strong> United States<br />
throughout its history. Up to 1960 <strong>the</strong> major<br />
emphasis has been on portfolio hold<strong>in</strong>gs<br />
<strong>of</strong> securities ra<strong>the</strong>r than direct <strong>in</strong>vestments.<br />
By 1960 foreign direct <strong>in</strong>vestment <strong>in</strong> <strong>the</strong> US<br />
totaled $6.9 billion - double <strong>the</strong> 1950 amount.<br />
From 1950 through 1965 growth averaged<br />
some $350 million annually. From 1965 to<br />
1970 annual growth accelerated to over $900<br />
million. Foreign direct <strong>in</strong>vestment <strong>in</strong>to <strong>the</strong><br />
US quadrupled <strong>in</strong> <strong>the</strong> 1970s, tripled this sum<br />
<strong>in</strong> <strong>the</strong> 1980s and has aga<strong>in</strong> almost doubled<br />
<strong>in</strong> <strong>the</strong> past decade.<br />
Europe's share <strong>of</strong> total FDI <strong>in</strong> <strong>the</strong> USA has<br />
rema<strong>in</strong>ed overwhelm<strong>in</strong>g over <strong>the</strong> past 60<br />
years - over 70 percent is Europe-sourced<br />
today. The Ne<strong>the</strong>rlands' share <strong>of</strong> European<br />
<strong>in</strong>vestment <strong>in</strong> <strong>the</strong> US is about 12 percent.<br />
The country is <strong>the</strong> third largest <strong>in</strong>vestor <strong>in</strong><br />
<strong>the</strong> US after <strong>the</strong> UK and Japan.<br />
1950 1957 1960 1965 1970 1975 1980 1985 1990 1995 2000 2005 2010p<br />
All Countries 11.78 25.39 32.77 49.32 75.48 124.05 215.37 238.36 430.52 699.01 1,316.24 2,241.65 3,908.23<br />
Europe 1.73 4.15 6.68 13.98 25.25 49.31 96.28 108.66 214.73 344.59 687.32 1,210.67 2,185.89<br />
Ne<strong>the</strong>rlands 0.08 0.19 0.28 0.68 1.55 3.09 8.04 7.55 19.12 42.11 115.42 240.20 521.42<br />
% <strong>in</strong> NL <strong>of</strong> US<br />
Investment <strong>in</strong> Europe<br />
4.6% 4.6% 4.2% 4.8% 6.1% 6.2% 8.3% 6.9% 8.9% 12.2% 16.7% 19.8% 23.8%<br />
p = prelim<strong>in</strong>ary figures published July 2011<br />
Source: Survey <strong>of</strong> Current Bus<strong>in</strong>ess published by Bureau <strong>of</strong> Economic Analysis, US Department <strong>of</strong> <strong>Commerce</strong><br />
The Transatlantic Economy Today - Investment<br />
Driven*<br />
While trade is <strong>of</strong>ten seen as <strong>the</strong> conventional<br />
yardstick for measur<strong>in</strong>g economic <strong>in</strong>teraction<br />
between countries, it is foreign <strong>in</strong>vestment<br />
- <strong>the</strong> deepest form <strong>of</strong> global <strong>in</strong>tegration<br />
- that b<strong>in</strong>ds <strong>the</strong> transatlantic economy<br />
toge<strong>the</strong>r. Here are some observations on <strong>the</strong><br />
transatlantic economic bond between <strong>the</strong><br />
United States and Europe.<br />
Despite <strong>the</strong> recession, <strong>the</strong> US and Europe<br />
rema<strong>in</strong> each o<strong>the</strong>r’s most important markets.<br />
No o<strong>the</strong>r commercial artery <strong>in</strong> <strong>the</strong> world is<br />
as <strong>in</strong>tegrated. The transatlantic economy<br />
generates close to $5 trillion <strong>in</strong> total commercial<br />
sales a year and employs up to 15 million<br />
workers <strong>in</strong> mutually “onshored” jobs on<br />
both sides <strong>of</strong> <strong>the</strong> Atlantic. The transatlantic<br />
economy is <strong>the</strong> largest and wealthiest market<br />
<strong>in</strong> <strong>the</strong> world: 54% <strong>of</strong> world GDP <strong>in</strong> terms <strong>of</strong><br />
value and 40% <strong>in</strong> terms <strong>of</strong> purchas<strong>in</strong>g power.<br />
As globalization proceeds and emerg<strong>in</strong>g<br />
markets rise, however, transatlantic markets<br />
are shift<strong>in</strong>g from a position <strong>of</strong> preem<strong>in</strong>ence to<br />
one <strong>of</strong> predom<strong>in</strong>ance - still considerable, but<br />
less overwhelm<strong>in</strong>g than <strong>in</strong> <strong>the</strong> past. Between<br />
2000 and 2010 US firms sunk roughly $1.3<br />
trillion <strong>in</strong>to Europe - over 60% <strong>of</strong> total US<br />
FDI for <strong>the</strong> entire decade. Europe’s share<br />
<strong>of</strong> total US FDI <strong>in</strong> 2010 was roughly 52%.<br />
Over <strong>the</strong> past decade 5 <strong>of</strong> <strong>the</strong> top 10 US FDI<br />
markets were European:<br />
1. NL<br />
7. Germany<br />
2. UK<br />
8. S<strong>in</strong>gapore<br />
3. Canada 9. Australia<br />
4. Ireland 10. Japan<br />
5. Switzerland 11. Belgium<br />
6. Mexico 15. Spa<strong>in</strong><br />
US <strong>in</strong>vestment <strong>in</strong> <strong>the</strong> NL 2000-2010 was 9<br />
times more than <strong>in</strong> Ch<strong>in</strong>a. US <strong>in</strong>vestment <strong>in</strong><br />
<strong>the</strong> UK was over 7 times more and <strong>in</strong> Ireland<br />
nearly 3 times more.<br />
S<strong>in</strong>ce 2000 US firms have <strong>in</strong>vested more <strong>in</strong> <strong>the</strong><br />
Ne<strong>the</strong>rlands alone than <strong>in</strong> South and Central<br />
America, <strong>the</strong> Middle East and Africa comb<strong>in</strong>ed.<br />
Roughly 60% <strong>of</strong> US assets were located <strong>in</strong><br />
Europe. Largest share: <strong>the</strong> UK (14%, $1.6<br />
trillion <strong>in</strong> 2008)—more than total comb<strong>in</strong>ed<br />
US assets <strong>in</strong> Asia, South America, Africa and<br />
<strong>the</strong> Middle East.<br />
US assets <strong>in</strong> <strong>the</strong> NL ($1.2 trillion) were 2 nd<br />
largest <strong>in</strong> <strong>the</strong> world <strong>in</strong> 2008. More than half<br />
<strong>of</strong> US affiliate sales <strong>in</strong> <strong>the</strong> Ne<strong>the</strong>rlands are<br />
for export with<strong>in</strong> <strong>the</strong> EU.<br />
Europe accounted for 53% <strong>of</strong> total foreign<br />
output <strong>of</strong> US affiliates (nearly $1.2 trillion<br />
<strong>in</strong> 2008).<br />
Foreign Direct Investment Position <strong>in</strong> <strong>the</strong> USA on a Historical-Cost Basis - Billions <strong>of</strong> US Dollars<br />
1950 1965 1970 1980 1990 1995 2000 2005 2010p<br />
All Countries 3.39 8.79 13.27 68.35 394.91 535.55 1,256.87 1,634.12 2,342.83<br />
Europe 2.13 6.07 9.55 45.73 247.32 332.37 887.01 1,154.08 1,697.19<br />
Ne<strong>the</strong>rlands 0.33 1.30 2.15 16.91 64.67 65.11 138.89 156.60 217.05<br />
p = prelim<strong>in</strong>ary figures published July 2011<br />
Source: Survey <strong>of</strong> Current Bus<strong>in</strong>ess, US Department <strong>of</strong> <strong>Commerce</strong>, Bureau <strong>of</strong> Economic Analysis<br />
Europe rema<strong>in</strong>s <strong>the</strong> most pr<strong>of</strong>itable region<br />
<strong>of</strong> <strong>the</strong> world for US firms. US foreign affiliate<br />
<strong>in</strong>come earned <strong>in</strong> Europe rose to an estimated<br />
$196 billion <strong>in</strong> 2010 - a record high - after<br />
collaps<strong>in</strong>g <strong>in</strong> 2009.<br />
Even <strong>in</strong> recession year 2009 Europe accounted<br />
for over 53% <strong>of</strong> total global affiliate earn<strong>in</strong>gs<br />
for US companies, and 57% s<strong>in</strong>ce 2000.<br />
US affiliates <strong>in</strong> 2009 earned over 6 times<br />
more <strong>in</strong> <strong>the</strong> NL ($53 billion) than <strong>in</strong> Ch<strong>in</strong>a<br />
and India ($8.7 billion).<br />
2,200,000<br />
2,000,000<br />
1,800,000<br />
1,600,000<br />
1,400,000<br />
1,200,000<br />
1,000,000<br />
800,000<br />
600,000<br />
400,000<br />
200,000<br />
0<br />
US Direct Investment Position Abroad on a Historical-Cost Basis<br />
Balance <strong>of</strong> PaymentsDirect Investment Position Data (Millions <strong>of</strong> Dollars)<br />
1982 1984 1986 1988 1990 1992 1994 1996 1998 2000 2002 2004 2006 2008 2010<br />
Ne<strong>the</strong>rlands / All Industries Total Europe / All Industries Total<br />
The US was <strong>the</strong> top recipient <strong>of</strong> EU FDI<br />
outflows <strong>in</strong> 2010. European <strong>in</strong>flows totaled<br />
$106 billion <strong>in</strong> <strong>the</strong> first n<strong>in</strong>e months <strong>of</strong> 2010,<br />
a 70% rise from <strong>the</strong> same period a year earlier.<br />
That equates to an annualized figure <strong>of</strong> around<br />
$140 billion - a marked improvement from<br />
2009, yet still well below 2008 ($202 billion).<br />
The upturn <strong>in</strong> US <strong>in</strong>flows from Europe<br />
was led by <strong>the</strong> Ne<strong>the</strong>rlands (+391%), <strong>the</strong><br />
United K<strong>in</strong>gdom (+93%), Switzerland<br />
(+87%), Ireland (+85%), Germany (+53%)<br />
and France (+17%). Comb<strong>in</strong>ed, <strong>the</strong>se six<br />
countries accounted for nearly two- thirds<br />
<strong>of</strong> total EU <strong>in</strong>vestment <strong>in</strong> <strong>the</strong> US <strong>the</strong> first<br />
n<strong>in</strong>e months <strong>of</strong> 2010.<br />
In recession year 2009 Europe’s <strong>in</strong>vestment<br />
stakes <strong>in</strong> <strong>the</strong> US totaled a record $1.7 trillion,<br />
a 13% rise from 2008 and more than triple <strong>the</strong><br />
level <strong>of</strong> a decade earlier. Corporate Europe<br />
accounted for 74% <strong>of</strong> total foreign direct<br />
<strong>in</strong>vestment <strong>in</strong> <strong>the</strong> US <strong>in</strong> 2009 ($2.3 trillion).<br />
In 2009 EU FDI <strong>in</strong> <strong>the</strong> US (€1.1 trillion) was<br />
almost 13 times more than EU comb<strong>in</strong>ed<br />
<strong>in</strong>vestment <strong>in</strong> Ch<strong>in</strong>a and India (€85.5<br />
billion). EU FDI <strong>in</strong> Ch<strong>in</strong>a totaled €58.3 billion<br />
<strong>in</strong> 2009, up from €47.2 billion <strong>in</strong> 2008, while<br />
EU FDI <strong>in</strong> India tallied just €27.2 billion <strong>in</strong><br />
2009, up from only €19.3 billion <strong>in</strong> 2008.<br />
Between 2001 and 2009 EU FDI outflows to<br />
<strong>the</strong> BRICs represented only 8.4% <strong>of</strong> global<br />
EU FDI outflows; most was to Brazil and<br />
Russia, not Ch<strong>in</strong>a and India.<br />
EU <strong>in</strong>vestment assets <strong>in</strong> <strong>the</strong> US are 3 times<br />
<strong>the</strong> size <strong>of</strong> those <strong>in</strong> <strong>the</strong> BRICs.<br />
The US is <strong>the</strong> most important market <strong>in</strong> <strong>the</strong><br />
world <strong>in</strong> terms <strong>of</strong> European global earn<strong>in</strong>gs:<br />
$105 billion <strong>in</strong> 2010.<br />
* quoted from: The Transatlantic Economy 2011 by<br />
Daniel S. Hamilton and joseph P. qu<strong>in</strong>lan, Center for<br />
Transatlantic Relations, johns Hopk<strong>in</strong>s University,<br />
Wash<strong>in</strong>gton DC.<br />
Source: U.S. Bureau <strong>of</strong> Economic Analysis<br />
51


![912.025 AmCham News [1] - American Chamber of Commerce in ...](https://img.yumpu.com/9328612/1/190x127/912025-amcham-news-1-american-chamber-of-commerce-in-.jpg?quality=85)


