Full Paper - ESEE 2011 - Advancing Ecological Economics
Full Paper - ESEE 2011 - Advancing Ecological Economics
Full Paper - ESEE 2011 - Advancing Ecological Economics

Create successful ePaper yourself
Turn your PDF publications into a flip-book with our unique Google optimized e-Paper software.
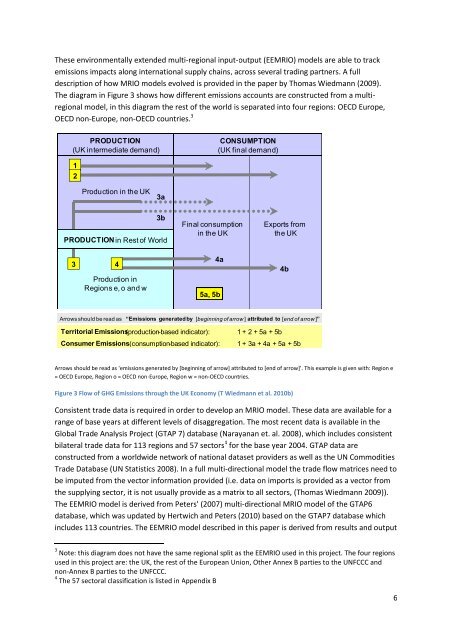
These environmentally extended multi-regional input-output (EEMRIO) models are able to track<br />
emissions impacts along international supply chains, across several trading partners. A full<br />
description of how MRIO models evolved is provided in the paper by Thomas Wiedmann (2009).<br />
The diagram in Figure 3 shows how different emissions accounts are constructed from a multiregional<br />
model, in this diagram the rest of the world is separated into four regions: OECD Europe,<br />
OECD non-Europe, non-OECD countries. 3<br />
PRODUCTION<br />
(UK intermediate demand)<br />
1<br />
2<br />
Production in the UK<br />
The image cannot be displayed. Your<br />
PRODUCTIONin computer may not have enough Rest memory of World to…<br />
3<br />
4<br />
Production in<br />
Regions e, o and w<br />
3a<br />
3b<br />
Final consumption<br />
in the UK<br />
5a, 5b<br />
CONSUMPTION<br />
(UK final demand)<br />
Exports from<br />
the UK<br />
Arrows should be read as “Emissions generatedby [beginning of arrow ] attributed to [end of arrow ]”<br />
Territorial Emissions(production-based indicator): 1 + 2 + 5a + 5b<br />
Consumer Emissions(consumption-based indicator): 1 + 3a + 4a + 5a + 5b<br />
Arrows should be read as 'emissions generated by [beginning of arrow] attributed to [end of arrow]'. This example is given with: Region e<br />
= OECD Europe, Region o = OECD non-Europe, Region w = non-OECD countries.<br />
Figure 3 Flow of GHG Emissions through the UK Economy (T Wiedmann et al. 2010b)<br />
4a<br />
Consistent trade data is required in order to develop an MRIO model. These data are available for a<br />
range of base years at different levels of disaggregation. The most recent data is available in the<br />
Global Trade Analysis Project (GTAP 7) database (Narayanan et. al. 2008), which includes consistent<br />
bilateral trade data for 113 regions and 57 sectors 4 for the base year 2004. GTAP data are<br />
constructed from a worldwide network of national dataset providers as well as the UN Commodities<br />
Trade Database (UN Statistics 2008). In a full multi-directional model the trade flow matrices need to<br />
be imputed from the vector information provided (i.e. data on imports is provided as a vector from<br />
the supplying sector, it is not usually provide as a matrix to all sectors, (Thomas Wiedmann 2009)).<br />
The EEMRIO model is derived from Peters' (2007) multi-directional MRIO model of the GTAP6<br />
database, which was updated by Hertwich and Peters (2010) based on the GTAP7 database which<br />
includes 113 countries. The EEMRIO model described in this paper is derived from results and output<br />
3 Note: this diagram does not have the same regional split as the EEMRIO used in this project. The four regions<br />
used in this project are: the UK, the rest of the European Union, Other Annex B parties to the UNFCCC and<br />
non-Annex B parties to the UNFCCC.<br />
4 The 57 sectoral classification is listed in Appendix B<br />
4b<br />
6