A study of the alanine dosimeter irradiation temperature coefficient ...
A study of the alanine dosimeter irradiation temperature coefficient ...
A study of the alanine dosimeter irradiation temperature coefficient ...

You also want an ePaper? Increase the reach of your titles
YUMPU automatically turns print PDFs into web optimized ePapers that Google loves.
366<br />
Relative Response<br />
1.05<br />
1.00<br />
0.95<br />
0.90<br />
0.85<br />
0.80<br />
0.75<br />
0.70<br />
0.65<br />
0.60<br />
-100 -80<br />
Harwell <strong>alanine</strong> <strong>dosimeter</strong>s were also irradiated to<br />
<strong>the</strong>se same doses but at <strong>temperature</strong>s in <strong>the</strong> range<br />
77 C to 10 C. Dosimeter response measurements<br />
were adjusted to <strong>the</strong> same relative value in Fig. 1 and<br />
plotted versus <strong>irradiation</strong> <strong>temperature</strong> (Fig. 2). A<br />
marked deviation from linearity was apparent at each<br />
dose level. The deviation from linearity became greater<br />
as <strong>the</strong> <strong>temperature</strong> decreased. The discrepancy in<br />
relative response at 77 C was 10–20% lower than<br />
would be predicted from <strong>the</strong> linear trend in <strong>the</strong> high<br />
<strong>temperature</strong> region (> 10 C) <strong>of</strong> <strong>the</strong> plot. Also, evident<br />
from <strong>the</strong>se data is a dependence <strong>of</strong> <strong>the</strong> relative response<br />
curve on <strong>the</strong> absorbed dose. The relative response<br />
decreases as <strong>the</strong> dose increases.<br />
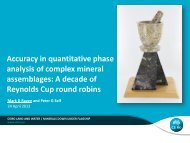
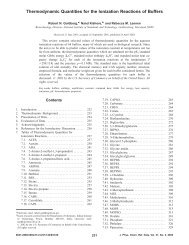
In order to correlate <strong>dosimeter</strong> measurements made<br />
on <strong>the</strong> NIST and Clearant spectrometers, <strong>the</strong> relative<br />
responses for each <strong>of</strong> <strong>the</strong> same sets <strong>of</strong> 5 and 50 kGy<br />
<strong>dosimeter</strong>s were measured on <strong>the</strong> two spectrometers.<br />
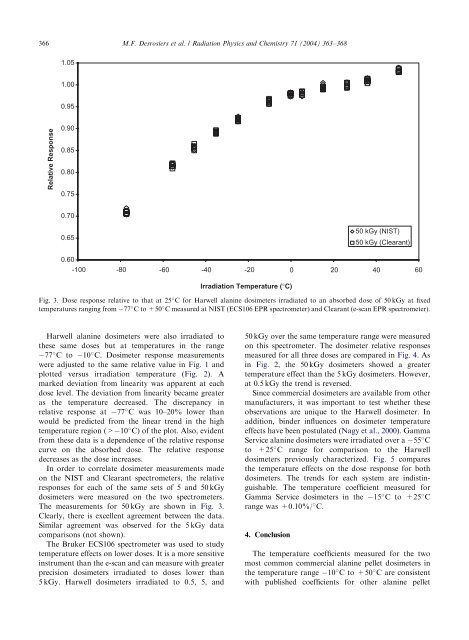
The measurements for 50 kGy are shown in Fig. 3.<br />
Clearly, <strong>the</strong>re is excellent agreement between <strong>the</strong> data.<br />
Similar agreement was observed for <strong>the</strong> 5 kGy data<br />
comparisons (not shown).<br />
The Bruker ECS106 spectrometer was used to <strong>study</strong><br />
<strong>temperature</strong> effects on lower doses. It is a more sensitive<br />
instrument than <strong>the</strong> e-scan and can measure with greater<br />
precision <strong>dosimeter</strong>s irradiated to doses lower than<br />
5 kGy. Harwell <strong>dosimeter</strong>s irradiated to 0.5, 5, and<br />
ARTICLE IN PRESS<br />
M.F. Desrosiers et al. / Radiation Physics and Chemistry 71 (2004) 363–368<br />
Irradiation Temperature (°C)<br />
50 kGy over <strong>the</strong> same <strong>temperature</strong> range were measured<br />
on this spectrometer. The <strong>dosimeter</strong> relative responses<br />
measured for all three doses are compared in Fig. 4. As<br />
in Fig. 2, <strong>the</strong> 50 kGy <strong>dosimeter</strong>s showed a greater<br />
<strong>temperature</strong> effect than <strong>the</strong> 5 kGy <strong>dosimeter</strong>s. However,<br />
at 0.5 kGy <strong>the</strong> trend is reversed.<br />
Since commercial <strong>dosimeter</strong>s are available from o<strong>the</strong>r<br />
manufacturers, it was important to test whe<strong>the</strong>r <strong>the</strong>se<br />
observations are unique to <strong>the</strong> Harwell <strong>dosimeter</strong>. In<br />
addition, binder influences on <strong>dosimeter</strong> <strong>temperature</strong><br />
effects have been postulated (Nagy et al., 2000). Gamma<br />
Service <strong>alanine</strong> <strong>dosimeter</strong>s were irradiated over a 55 C<br />
to +25 C range for comparison to <strong>the</strong> Harwell<br />
<strong>dosimeter</strong>s previously characterized. Fig. 5 compares<br />
<strong>the</strong> <strong>temperature</strong> effects on <strong>the</strong> dose response for both<br />
<strong>dosimeter</strong>s. The trends for each system are indistinguishable.<br />
The <strong>temperature</strong> <strong>coefficient</strong> measured for<br />
Gamma Service <strong>dosimeter</strong>s in <strong>the</strong> 15 C to +25 C<br />
range was +0.10%/ C.<br />
4. Conclusion<br />
50 kGy (NIST)<br />
50 kGy (Clearant)<br />
-60 -40 -20 0 20 40 60<br />
Fig. 3. Dose response relative to that at 25 C for Harwell <strong>alanine</strong> <strong>dosimeter</strong>s irradiated to an absorbed dose <strong>of</strong> 50 kGy at fixed<br />
<strong>temperature</strong>s ranging from 77 Cto+50 C measured at NIST (ECS106 EPR spectrometer) and Clearant (e-scan EPR spectrometer).<br />
The <strong>temperature</strong> <strong>coefficient</strong>s measured for <strong>the</strong> two<br />
most common commercial <strong>alanine</strong> pellet <strong>dosimeter</strong>s in<br />
<strong>the</strong> <strong>temperature</strong> range 10 C to +50 C are consistent<br />
with published <strong>coefficient</strong>s for o<strong>the</strong>r <strong>alanine</strong> pellet