President's Report 2007/8 - Division for Development and Public ...
President's Report 2007/8 - Division for Development and Public ...
President's Report 2007/8 - Division for Development and Public ...

You also want an ePaper? Increase the reach of your titles
YUMPU automatically turns print PDFs into web optimized ePapers that Google loves.
54-55 / Financial <strong>Report</strong><br />
Table 3C Non-Experimental Units<br />
Expenditure<br />
Salaries<br />
Acquisitions<br />
Scholarships<br />
Other<br />
Total<br />
Humanities<br />
25.7<br />
0.2<br />
0.6<br />
0.6<br />
27.1<br />
Social<br />
Sciences<br />
21.1<br />
0.2<br />
0.7<br />
1.2<br />
23.2<br />
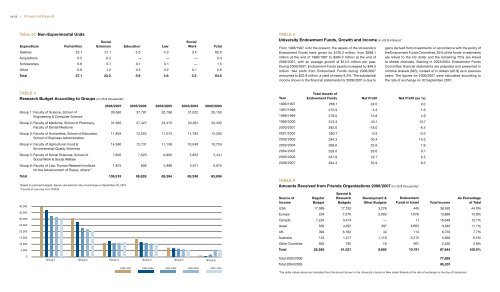
TABLE 4<br />
Research Budget According to Groups (in US $ thous<strong>and</strong>s)*<br />
Group 1: Faculty of Science, School of<br />
Engineering & Computer Science<br />
Group 2: Faculty of Medicine, School of Pharmacy,<br />
Faculty of Dental Medicine<br />
Group 3: Faculty of Humanities, School of Education,<br />
School of Business Administration<br />
Group 4: Faculty of Agricultural, Food &<br />
Environmental Quality Sciences<br />
Group 5: Faculty of Social Sciences, School of<br />
Social Work & Social Welfare<br />
Group 6: Faculty of Law, Truman Research Institute<br />
<strong>for</strong> the Advancement of Peace, others**<br />
Total<br />
*Based on planned budgets; figures calculated at rate of exchange on September 30, <strong>2007</strong><br />
**Faculty of Law only from 2005/6<br />
40,000<br />
35,000<br />
30,000<br />
25,000<br />
20,000<br />
15,000<br />
10,000<br />
5,000<br />
0<br />
2006/<strong>2007</strong><br />
39,560<br />
31,665<br />
11,859<br />
14,360<br />
7,600<br />
1,875<br />
106,919<br />
Education<br />
5.3<br />
—<br />
0.1<br />
0.5<br />
5.9<br />
2005/2006<br />
37,781<br />
27,427<br />
13,553<br />
12,731<br />
7,525<br />
809<br />
99,826<br />
Law<br />
4.3<br />
—<br />
0.1<br />
0.2<br />
4.8<br />
2004/2005<br />
32,796<br />
23,470<br />
11,072<br />
11,158<br />
6,900<br />
2,998<br />
88,394<br />
Social<br />
Work<br />
3.4<br />
—<br />
—<br />
0.1<br />
3.5<br />
2003/2004<br />
31,022<br />
23,061<br />
11,793<br />
10,549<br />
5,852<br />
5,971<br />
88,248<br />
Total<br />
60.0<br />
0.4<br />
1.5<br />
2.6<br />
64.5<br />
2002/2003<br />
Group 1 Group 2 Group 3 Group 4 Group 5 Group 6<br />
2006-<strong>2007</strong><br />
29,150<br />
20,332<br />
12,205<br />
10,753<br />
5,441<br />
5,975<br />
83,856<br />
2005-2006 2004-2005 2003-2004 2002-2003<br />
TABLE 5<br />
University Endowment Funds, Growth <strong>and</strong> Income (in US $ millions)*<br />
From 1996/1997 until the present, the assets of the University’s<br />
Endowment Funds have grown by $126.2 million, from $268.1<br />
million at the end of 1996/1997 to $394.3 million at the end of<br />
2006/<strong>2007</strong>, with an average growth of $12.6 million per year.<br />
During 2006/<strong>2007</strong>, Endowment Funds assets increased by $46.5<br />
million. Net profit from Endowment Funds during 2006/<strong>2007</strong><br />
amounted to $32.9 million, a yield of nearly 8.3%. The substantial<br />
income shown in the financial statements <strong>for</strong> 2006/<strong>2007</strong> is due to<br />
Year<br />
1996/1997<br />
1997/1998<br />
1998/1999<br />
1999/2000<br />
2000/2001<br />
2001/2002<br />
2002/2003<br />
2003/2004<br />
2004/2005<br />
2005/2006<br />
2006/<strong>2007</strong><br />
Source of<br />
Income<br />
USA<br />
Europe<br />
Canada<br />
Israel<br />
UK<br />
Australia<br />
Other Countries<br />
Total<br />
Total 2005/2006<br />
Total 2004/2005<br />
Total Assets of<br />
Endowment Funds<br />
Regular<br />
Budget<br />
17,089<br />
234<br />
7,224<br />
530<br />
394<br />
142<br />
953<br />
26,566<br />
268.1<br />
272.9<br />
279.0<br />
313.3<br />
282.6<br />
280.7<br />
294.3<br />
308.6<br />
328.0<br />
347.8<br />
394.3<br />
Special &<br />
Research<br />
Budgets<br />
17,752<br />
7,576<br />
3,414<br />
4,097<br />
6,183<br />
1,217<br />
792<br />
41,031<br />
Net Profit<br />
24.0<br />
4.3<br />
13.8<br />
43.1<br />
-18.0<br />
-0.9<br />
30.4<br />
23.6<br />
26.6<br />
22.7<br />
32.9<br />
<strong>Development</strong> &<br />
Other Budgets<br />
gains derived from investments. In accordance with the policy of<br />
the Endowment Funds Committee, 25% of the funds’ investments<br />
are linked to the US dollar <strong>and</strong> the remaining 75% are linked<br />
to shekel channels. Starting in 2003/2004, Endowment Funds<br />
Committee financial statements are prepared <strong>and</strong> presented in<br />
nominal shekels (NIS), instead of in dollars (US $) as in previous<br />
years. The figures <strong>for</strong> 2006/<strong>2007</strong> were calculated according to<br />
the rate of exchange on 30 September <strong>2007</strong>.<br />
Net Profit (as %)<br />
TABLE 6<br />
Amounts Received from Friends Organizations 2006/<strong>2007</strong> (in US $ thous<strong>and</strong>s)*<br />
*The dollar values above are translated from the amount shown in the University’s books in New Israeli Shekels at the rate of exchange on the day of transaction.<br />
3,276<br />
5,003<br />
—<br />
397<br />
44<br />
1,118<br />
18<br />
9,856<br />
Endowment<br />
Funds in Israel<br />
445<br />
1,076<br />
11<br />
4,663<br />
114<br />
3,215<br />
667<br />
10,191<br />
9.0<br />
1.6<br />
4.9<br />
13.7<br />
-6.4<br />
-0.3<br />
10.3<br />
7.6<br />
8.1<br />
6.5<br />
8.3<br />
Total Income<br />
38,562<br />
13,889<br />
10,649<br />
9,687<br />
6,735<br />
5,692<br />
2,430<br />
87,644<br />
77,995<br />
85,301<br />
As Percentage<br />
of Total<br />
44.0%<br />
15.8%<br />
12.1%<br />
11.1%<br />
7.7%<br />
6.5%<br />
2.8%<br />
100.0%