

ANNUAL REPORT - Western Reserve Group
ANNUAL REPORT - Western Reserve Group
ANNUAL REPORT - Western Reserve Group

You also want an ePaper? Increase the reach of your titles
YUMPU automatically turns print PDFs into web optimized ePapers that Google loves.
WRG<br />
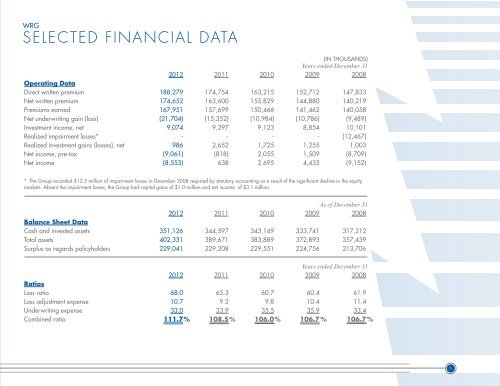
sELEcTEd fiNANciAL dATA<br />
(IN THOUSANDS)<br />
Years ended December 31<br />
2012 2011 2010 2009 2008<br />
Operating Data<br />
Direct written premium 188,279 174,754 163,215 152,712 147,833<br />
Net written premium 174,652 163,600 155,829 144,880 140,219<br />
Premiums earned 167,951 157,699 150,466 141,462 140,058<br />
Net underwriting gain (loss) (21,704) (15,352) (10,984) (10,786) (9,489)<br />
Investment income, net 9,074 9,297 9,123 8,854 10,101<br />
Realized impairment losses* - - - - (12,467)<br />
Realized investment gains (losses), net 986 2,652 1,725 1,255 1,003<br />
Net income, pre-tax (9,061) (818) 2,055 1,509 (8,709)<br />
Net income (8,553) 638 2,695 4,435 (9,152)<br />
* The <strong>Group</strong> recorded $12.5 million of impairment losses in December 2008 required by statutory accounting as a result of the significant decline in the equity<br />
markets. Absent the impairment losses, the <strong>Group</strong> had capital gains of $1.0 million and net income of $3.1 million.<br />
As of December 31<br />
2012 2011 2010 2009 2008<br />
Balance Sheet Data<br />
Cash and invested assets 351,126 344,597 343,149 333,741 317,212<br />
Total assets 402,331 389,671 383,889 372,893 357,439<br />
Surplus as regards policyholders 229,041 229,208 229,551 224,756 213,706<br />
Years ended December 31<br />
2012 2011 2010 2009 2008<br />
Ratios<br />
Loss ratio 68.0 65.3 60.7 60.4 61.9<br />
Loss adjustment expense 10.7 9.3 9.8 10.4 11.4<br />
Underwriting expense 33.0 33.9 35.5 35.9 33.4<br />
Combined ratio 111.7 % 108.5 % 106.0 % 106.7 % 106.7%<br />
10 5