FIA U ANN U AL REPOR T 2011 - Financial Intelligence Analysis Unit
FIA U ANN U AL REPOR T 2011 - Financial Intelligence Analysis Unit
FIA U ANN U AL REPOR T 2011 - Financial Intelligence Analysis Unit

You also want an ePaper? Increase the reach of your titles
YUMPU automatically turns print PDFs into web optimized ePapers that Google loves.
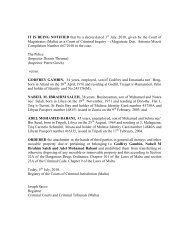
Table 6: Requests for co-operation and assistance (2003 – <strong>2011</strong>)<br />
Requests for assistance made by the <strong>FIA</strong>U<br />
As in previous years the majority of requests for co-operation<br />
made by the <strong>FIA</strong>U were directed to FIUs in European Union<br />
member states. Indeed, 64 percent of all requests made<br />
by the <strong>FIA</strong>U were made to FIUs in EU and EEA countries,<br />
together with another 17 percent being made to FIUs in<br />
European countries which are not members of the EU.<br />
The FIU of the <strong>Unit</strong>ed Kingdom received the highest number<br />
of requests for assistance, followed by the German FIU and<br />
the FIUs of Austria, Italy, Poland, the Russian Federation and<br />
the <strong>Unit</strong>ed States of America. A review of the contents of<br />
Table 7 reveals that the FIU of Estonia was the only FIU within<br />
the EU with which the <strong>FIA</strong>U did not exchange information<br />
during <strong>2011</strong>.<br />
A breakdown of requests for information made by the <strong>FIA</strong>U<br />
to foreign FIUs is provided hereunder:<br />
26<br />
Year<br />
Number of requests<br />
received by the <strong>FIA</strong>U<br />
Annual Report <strong>2011</strong><br />
Number of requests<br />
made by the <strong>FIA</strong>U<br />
Percentage difference between requests made by the <strong>FIA</strong>U<br />
and requests made to the <strong>FIA</strong>U<br />
2003 21 31 48%<br />
2004 33 76 130%<br />
2005 37 41 11%<br />
2006 23 43 87%<br />
2007 29 29 0%<br />
2008 44 28 -36%<br />
2009 46 83 80%<br />
2010 45 75 67%<br />
<strong>2011</strong> 97 142 46%<br />
Total 375 548 46%<br />
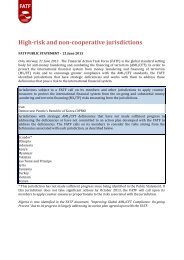
Chart 6: Response time for requests received and requests made by the <strong>FIA</strong>U (<strong>2011</strong>)<br />
Percentage of Total Responses to Requests for Information<br />
60%<br />
50%<br />
40%<br />
30%<br />
20%<br />
10%<br />
0%<br />
1 2-5 6-10 11-15 16-20 21-25 26-30 31-35 36-40 41-45 46-50 51+<br />
Working Days<br />
Response Time for Request Received Response Time for Requests Made<br />
• Eighty-eight requests to the FIUs of twenty-two EU<br />
member states.<br />
• Three requests to the FIUs of two EEA states.<br />
• Twenty-four requests to the FIUs of twelve European<br />
countries not in the EU or EEA.<br />
• Eighteen requests to 7 FIUs in the Americas.<br />
• Eight requests to 5 Asian FIUs.<br />
• One request to an African FIU.<br />
Requests for assistance made to the <strong>FIA</strong>U<br />
A review of the requests for assistance made to the <strong>FIA</strong>U<br />
during <strong>2011</strong> reveals that even in the case of inward requests,<br />
a large percentage (64 percent) also originated from EU and<br />
EEA FIUs while sixteen percent of requests were received<br />
from FIUs in non-EU European countries. Ten percent of the<br />
requests received by the <strong>FIA</strong>U were made by FIUs in the<br />
Americas while about eight percent of the requests were<br />
made by FIUs from Asian countries.