Anterior midline point stop device (AMPS) in the treatment of ...
Anterior midline point stop device (AMPS) in the treatment of ...
Anterior midline point stop device (AMPS) in the treatment of ...

You also want an ePaper? Increase the reach of your titles
YUMPU automatically turns print PDFs into web optimized ePapers that Google loves.
OOOOE<br />
744 Al Quran and Kamal June 2006<br />
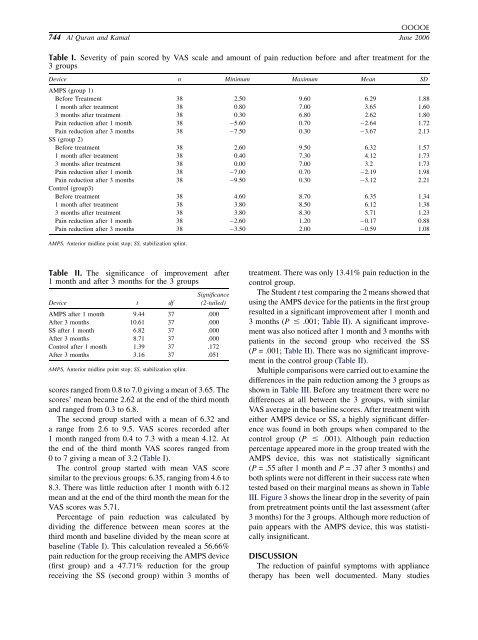
Table I. Severity <strong>of</strong> pa<strong>in</strong> scored by VAS scale and amount <strong>of</strong> pa<strong>in</strong> reduction before and after <strong>treatment</strong> for <strong>the</strong><br />
3 groups<br />
Device<br />
<strong>AMPS</strong> (group 1)<br />
n M<strong>in</strong>imum Maximum Mean SD<br />
Before Treatment 38 2.50 9.60 6.29 1.88<br />
1 month after <strong>treatment</strong> 38 0.80 7.00 3.65 1.60<br />
3 months after <strong>treatment</strong> 38 0.30 6.80 2.62 1.80<br />
Pa<strong>in</strong> reduction after 1 month 38 ÿ5.60 0.70 ÿ2.64 1.72<br />
Pa<strong>in</strong> reduction after 3 months<br />
SS (group 2)<br />
38 ÿ7.50 0.30 ÿ3.67 2.13<br />
Before <strong>treatment</strong> 38 2.60 9.50 6.32 1.57<br />
1 month after <strong>treatment</strong> 38 0.40 7.30 4.12 1.73<br />
3 months after <strong>treatment</strong> 38 0.00 7.00 3.2 1.73<br />
Pa<strong>in</strong> reduction after 1 month 38 ÿ7.00 0.70 ÿ2.19 1.98<br />
Pa<strong>in</strong> reduction after 3 months<br />
Control (group3)<br />
38 ÿ9.50 0.30 ÿ3.12 2.21<br />
Before <strong>treatment</strong> 38 4.60 8.70 6.35 1.34<br />
1 month after <strong>treatment</strong> 38 3.80 8.50 6.12 1.38<br />
3 months after <strong>treatment</strong> 38 3.80 8.30 5.71 1.23<br />
Pa<strong>in</strong> reduction after 1 month 38 ÿ2.60 1.20 ÿ0.17 0.88<br />
Pa<strong>in</strong> reduction after 3 months 38 ÿ3.50 2.00 ÿ0.59 1.08<br />
<strong>AMPS</strong>, <strong>Anterior</strong> <strong>midl<strong>in</strong>e</strong> <strong>po<strong>in</strong>t</strong> <strong>stop</strong>; SS, stabilization spl<strong>in</strong>t.<br />
Table II. The significance <strong>of</strong> improvement after<br />
1 month and after 3 months for <strong>the</strong> 3 groups<br />
Device t df<br />
Significance<br />
(2-tailed)<br />
<strong>AMPS</strong> after 1 month 9.44 37 .000<br />
After 3 months 10.61 37 .000<br />
SS after 1 month 6.82 37 .000<br />
After 3 months 8.71 37 .000<br />
Control after 1 month 1.39 37 .172<br />
After 3 months 3.16 37 .051<br />
<strong>AMPS</strong>, <strong>Anterior</strong> <strong>midl<strong>in</strong>e</strong> <strong>po<strong>in</strong>t</strong> <strong>stop</strong>; SS, stabilization spl<strong>in</strong>t.<br />
scores ranged from 0.8 to 7.0 giv<strong>in</strong>g a mean <strong>of</strong> 3.65. The<br />
scores’ mean became 2.62 at <strong>the</strong> end <strong>of</strong> <strong>the</strong> third month<br />
and ranged from 0.3 to 6.8.<br />
The second group started with a mean <strong>of</strong> 6.32 and<br />
a range from 2.6 to 9.5. VAS scores recorded after<br />
1 month ranged from 0.4 to 7.3 with a mean 4.12. At<br />
<strong>the</strong> end <strong>of</strong> <strong>the</strong> third month VAS scores ranged from<br />
0 to 7 giv<strong>in</strong>g a mean <strong>of</strong> 3.2 (Table I).<br />
The control group started with mean VAS score<br />
similar to <strong>the</strong> previous groups: 6.35, rang<strong>in</strong>g from 4.6 to<br />
8.3. There was little reduction after 1 month with 6.12<br />
mean and at <strong>the</strong> end <strong>of</strong> <strong>the</strong> third month <strong>the</strong> mean for <strong>the</strong><br />
VAS scores was 5.71.<br />
Percentage <strong>of</strong> pa<strong>in</strong> reduction was calculated by<br />
divid<strong>in</strong>g <strong>the</strong> difference between mean scores at <strong>the</strong><br />
third month and basel<strong>in</strong>e divided by <strong>the</strong> mean score at<br />
basel<strong>in</strong>e (Table I). This calculation revealed a 56.66%<br />
pa<strong>in</strong> reduction for <strong>the</strong> group receiv<strong>in</strong>g <strong>the</strong> <strong>AMPS</strong> <strong>device</strong><br />
(first group) and a 47.71% reduction for <strong>the</strong> group<br />
receiv<strong>in</strong>g <strong>the</strong> SS (second group) with<strong>in</strong> 3 months <strong>of</strong><br />
<strong>treatment</strong>. There was only 13.41% pa<strong>in</strong> reduction <strong>in</strong> <strong>the</strong><br />
control group.<br />
The Student t test compar<strong>in</strong>g <strong>the</strong> 2 means showed that<br />
us<strong>in</strong>g <strong>the</strong> <strong>AMPS</strong> <strong>device</strong> for <strong>the</strong> patients <strong>in</strong> <strong>the</strong> first group<br />
resulted <strong>in</strong> a significant improvement after 1 month and<br />
3 months (P # .001; Table II). A significant improvement<br />
was also noticed after 1 month and 3 months with<br />
patients <strong>in</strong> <strong>the</strong> second group who received <strong>the</strong> SS<br />
(P = .001; Table II). There was no significant improvement<br />
<strong>in</strong> <strong>the</strong> control group (Table II).<br />
Multiple comparisons were carried out to exam<strong>in</strong>e <strong>the</strong><br />
differences <strong>in</strong> <strong>the</strong> pa<strong>in</strong> reduction among <strong>the</strong> 3 groups as<br />
shown <strong>in</strong> Table III. Before any <strong>treatment</strong> <strong>the</strong>re were no<br />
differences at all between <strong>the</strong> 3 groups, with similar<br />
VAS average <strong>in</strong> <strong>the</strong> basel<strong>in</strong>e scores. After <strong>treatment</strong> with<br />
ei<strong>the</strong>r <strong>AMPS</strong> <strong>device</strong> or SS, a highly significant difference<br />
was found <strong>in</strong> both groups when compared to <strong>the</strong><br />
control group (P # .001). Although pa<strong>in</strong> reduction<br />
percentage appeared more <strong>in</strong> <strong>the</strong> group treated with <strong>the</strong><br />
<strong>AMPS</strong> <strong>device</strong>, this was not statistically significant<br />
(P = .55 after 1 month and P = .37 after 3 months) and<br />
both spl<strong>in</strong>ts were not different <strong>in</strong> <strong>the</strong>ir success rate when<br />
tested based on <strong>the</strong>ir marg<strong>in</strong>al means as shown <strong>in</strong> Table<br />
III. Figure 3 shows <strong>the</strong> l<strong>in</strong>ear drop <strong>in</strong> <strong>the</strong> severity <strong>of</strong> pa<strong>in</strong><br />
from pre<strong>treatment</strong> <strong>po<strong>in</strong>t</strong>s until <strong>the</strong> last assessment (after<br />
3 months) for <strong>the</strong> 3 groups. Although more reduction <strong>of</strong><br />
pa<strong>in</strong> appears with <strong>the</strong> <strong>AMPS</strong> <strong>device</strong>, this was statistically<br />
<strong>in</strong>significant.<br />
DISCUSSION<br />
The reduction <strong>of</strong> pa<strong>in</strong>ful symptoms with appliance<br />
<strong>the</strong>rapy has been well documented. Many studies