2012 Synthesis of Results - Interpump
2012 Synthesis of Results - Interpump
2012 Synthesis of Results - Interpump

You also want an ePaper? Increase the reach of your titles
YUMPU automatically turns print PDFs into web optimized ePapers that Google loves.
DIRECTORS’ REMARKS ON PERFORMANCE<br />
IN <strong>2012</strong> 10.<br />
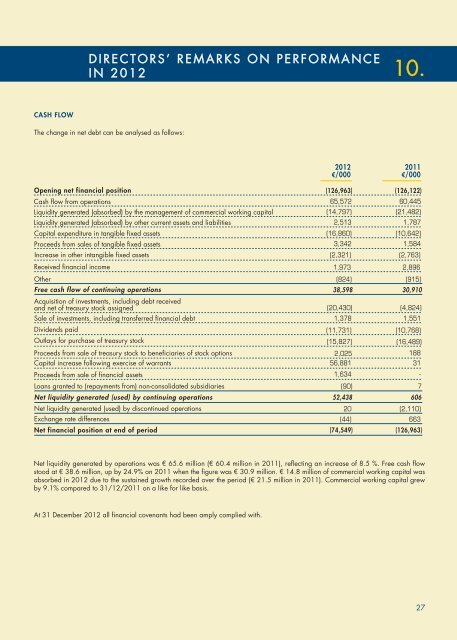
CASH FLOW<br />
The change in net debt can be analysed as follows:<br />
Opening net financial position<br />
Cash flow from operations<br />
Liquidity generated (absorbed) by the management <strong>of</strong> commercial working capital<br />
Liquidity generated (absorbed) by other current assets and liabilities<br />
Capital expenditure in tangible fixed assets<br />
Proceeds from sales <strong>of</strong> tangible fixed assets<br />
Increase in other intangible fixed assets<br />
Received financial income<br />
Other<br />
Free cash flow <strong>of</strong> continuing operations<br />
<strong>2012</strong><br />
€/000<br />
(126,963)<br />
65,572<br />
(14,797)<br />
2,513<br />
(16,860)<br />
3,342<br />
(2,321)<br />
1,973<br />
(824)<br />
38,598<br />
2011<br />
€/000<br />
(126,122)<br />
60,445<br />
(21,482)<br />
1,787<br />
(10,642)<br />
1,584<br />
(2,763)<br />
2,896<br />
(915)<br />
30,910<br />
Acquisition <strong>of</strong> investments, including debt received<br />
and net <strong>of</strong> treasury stock assigned<br />
(20,430)<br />
Sale <strong>of</strong> investments, including transferred financial debt 1,378<br />
(4,824)<br />
1,551<br />
Dividends paid<br />
Outlays for purchase <strong>of</strong> treasury stock<br />
Proceeds from sale <strong>of</strong> treasury stock to beneficiaries <strong>of</strong> stock options<br />
Capital increase following exercise <strong>of</strong> warrants<br />
Proceeds from sale <strong>of</strong> financial assets<br />
Loans granted to (repayments from) non-consolidated subsidiaries<br />
Net liquidity generated (used) by continuing operations<br />
(11,731)<br />
(15,827)<br />
2,025<br />
56,881<br />
1,634<br />
(90)<br />
52,438<br />
(10,768)<br />
(16,489)<br />
188<br />
31<br />
-<br />
7<br />
606<br />
Net liquidity generated (used) by discontinued operations 20 (2,110)<br />
Exchange rate differences<br />
Net financial position at end <strong>of</strong> period (74,549)<br />
(44)<br />
663<br />
(126,963)<br />
Net liquidity generated by operations was € 65.6 million (€ 60.4 million in 2011), reflecting an increase <strong>of</strong> 8.5 %. Free cash flow<br />
stood at € 38.6 million, up by 24.9% on 2011 when the figure was € 30.9 million. € 14.8 million <strong>of</strong> commercial working capital was<br />
absorbed in <strong>2012</strong> due to the sustained growth recorded over the period (€ 21.5 million in 2011). Commercial working capital grew<br />
by 9.1% compared to 31/12/2011 on a like for like basis.<br />
At 31 December <strong>2012</strong> all financial covenants had been amply complied with.<br />
27