Measuring personality traits with ultra-short scales: A study of the ...
Measuring personality traits with ultra-short scales: A study of the ...
Measuring personality traits with ultra-short scales: A study of the ...

You also want an ePaper? Increase the reach of your titles
YUMPU automatically turns print PDFs into web optimized ePapers that Google loves.
E. Romero et al. / Personality and Individual Differences xxx (2012) xxx–xxx 3<br />
3. Results<br />
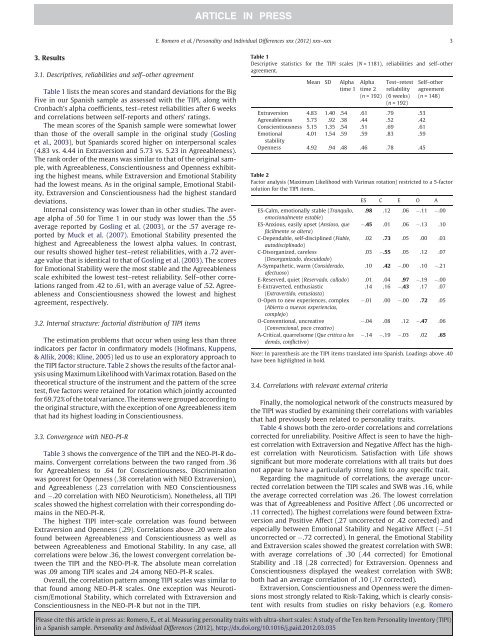
3.1. Descriptives, reliabilities and self–o<strong>the</strong>r agreement<br />
Table 1 lists <strong>the</strong> mean scores and standard deviations for <strong>the</strong> Big<br />
Five in our Spanish sample as assessed <strong>with</strong> <strong>the</strong> TIPI, along <strong>with</strong><br />
Cronbach’s alpha coefficients, test–retest reliabilities after 6 weeks<br />
and correlations between self-reports and o<strong>the</strong>rs’ ratings.<br />
The mean scores <strong>of</strong> <strong>the</strong> Spanish sample were somewhat lower<br />
than those <strong>of</strong> <strong>the</strong> overall sample in <strong>the</strong> original <strong>study</strong> (Gosling<br />
et al., 2003), but Spaniards scored higher on interpersonal <strong>scales</strong><br />
(4.83 vs. 4.44 in Extraversion and 5.73 vs. 5.23 in Agreeableness).<br />
The rank order <strong>of</strong> <strong>the</strong> means was similar to that <strong>of</strong> <strong>the</strong> original sample,<br />
<strong>with</strong> Agreeableness, Conscientiousness and Openness exhibiting<br />
<strong>the</strong> highest means, while Extraversion and Emotional Stability<br />
had <strong>the</strong> lowest means. As in <strong>the</strong> original sample, Emotional Stability,<br />
Extraversion and Conscientiousness had <strong>the</strong> highest standard<br />
deviations.<br />
Internal consistency was lower than in o<strong>the</strong>r studies. The average<br />
alpha <strong>of</strong> .50 for Time 1 in our <strong>study</strong> was lower than <strong>the</strong> .55<br />
average reported by Gosling et al. (2003), or <strong>the</strong> .57 average reported<br />
by Muck et al. (2007). Emotional Stability presented <strong>the</strong><br />
highest and Agreeableness <strong>the</strong> lowest alpha values. In contrast,<br />
our results showed higher test–retest reliabilities, <strong>with</strong> a .72 average<br />
value that is identical to that <strong>of</strong> Gosling et al. (2003). The scores<br />
for Emotional Stability were <strong>the</strong> most stable and <strong>the</strong> Agreeableness<br />
scale exhibited <strong>the</strong> lowest test–retest reliability. Self–o<strong>the</strong>r correlations<br />
ranged from .42 to .61, <strong>with</strong> an average value <strong>of</strong> .52. Agreeableness<br />
and Conscientiousness showed <strong>the</strong> lowest and highest<br />
agreement, respectively.<br />
3.2. Internal structure: factorial distribution <strong>of</strong> TIPI items<br />
The estimation problems that occur when using less than three<br />
indicators per factor in confirmatory models (H<strong>of</strong>mans, Kuppens,<br />
& Allik, 2008; Kline, 2005) led us to use an exploratory approach to<br />
<strong>the</strong> TIPI factor structure. Table 2 shows <strong>the</strong> results <strong>of</strong> <strong>the</strong> factor analysis<br />
using Maximum Likelihood <strong>with</strong> Varimax rotation. Based on <strong>the</strong><br />
<strong>the</strong>oretical structure <strong>of</strong> <strong>the</strong> instrument and <strong>the</strong> pattern <strong>of</strong> <strong>the</strong> scree<br />
test, five factors were retained for rotation which jointly accounted<br />
for 69.72% <strong>of</strong> <strong>the</strong> total variance. The items were grouped according to<br />
<strong>the</strong> original structure, <strong>with</strong> <strong>the</strong> exception <strong>of</strong> one Agreeableness item<br />
that had its highest loading in Conscientiousness.<br />
3.3. Convergence <strong>with</strong> NEO-PI-R<br />
Table 3 shows <strong>the</strong> convergence <strong>of</strong> <strong>the</strong> TIPI and <strong>the</strong> NEO-PI-R domains.<br />
Convergent correlations between <strong>the</strong> two ranged from .36<br />
for Agreeableness to .64 for Conscientiousness. Discrimination<br />
was poorest for Openness (.38 correlation <strong>with</strong> NEO Extraversion),<br />
and Agreeableness (.23 correlation <strong>with</strong> NEO Conscientiousness<br />
and .20 correlation <strong>with</strong> NEO Neuroticism). None<strong>the</strong>less, all TIPI<br />
<strong>scales</strong> showed <strong>the</strong> highest correlation <strong>with</strong> <strong>the</strong>ir corresponding domains<br />
in <strong>the</strong> NEO-PI-R.<br />
The highest TIPI inter-scale correlation was found between<br />
Extraversion and Openness (.29). Correlations above .20 were also<br />
found between Agreeableness and Conscientiousness as well as<br />
between Agreeableness and Emotional Stability. In any case, all<br />
correlations were below .36, <strong>the</strong> lowest convergent correlation between<br />
<strong>the</strong> TIPI and <strong>the</strong> NEO-PI-R. The absolute mean correlation<br />
was .09 among TIPI <strong>scales</strong> and .24 among NEO-PI-R <strong>scales</strong>.<br />
Overall, <strong>the</strong> correlation pattern among TIPI <strong>scales</strong> was similar to<br />
that found among NEO-PI-R <strong>scales</strong>. One exception was Neuroticism/Emotional<br />
Stability, which correlated <strong>with</strong> Extraversion and<br />
Conscientiousness in <strong>the</strong> NEO-PI-R but not in <strong>the</strong> TIPI.<br />
Table 1<br />
Descriptive statistics for <strong>the</strong> TIPI <strong>scales</strong> (N = 1181), reliabilities and self–o<strong>the</strong>r<br />
agreement.<br />
Mean SD Alpha<br />
time 1<br />
Alpha<br />
time 2<br />
(n = 192)<br />
3.4. Correlations <strong>with</strong> relevant external criteria<br />
Test–retest<br />
reliability<br />
(6 weeks)<br />
(n = 192)<br />
Extraversion 4.83 1.40 .54 .61 .79 .53<br />
Agreeableness 5.73 .92 .38 .44 .52 .42<br />
Conscientiousness 5.15 1.35 .54 .51 .69 .61<br />
Emotional 4.01 1.54 .59 .59 .83 .59<br />
stability<br />
Openness 4.92 .94 .48 .46 .78 .45<br />
Self–o<strong>the</strong>r<br />
agreement<br />
(n = 148)<br />
Table 2<br />
Factor analysis (Maximum Likelihood <strong>with</strong> Varimax rotation) restricted to a 5-factor<br />
solution for <strong>the</strong> TIPI items.<br />
ES C E O A<br />
ES-Calm, emotionally stable (Tranquilo, .98 .12 .06 .11 .00<br />
emocionalmente estable)<br />
ES-Anxious, easily upset (Ansioso, que .45 .01 .06 .13 .10<br />
fácilmente se altera)<br />
C-Dependable, self-disciplined (Fiable, .02 .73 .05 .00 .03<br />
autodisciplinado)<br />
C-Disorganized, careless<br />
.03 .55 .05 .12 .07<br />
(Desorganizado, descuidado)<br />
A-Sympa<strong>the</strong>tic, warm (Considerado, .10 .42 .00 .10 .21<br />
afectuoso)<br />
E-Reserved, quiet (Reservado, callado) .01 .04 .97 .19 .00<br />
E-Extraverted, enthusiastic<br />
.14 .16 .43 .17 .07<br />
(Extravertido, entusiasta)<br />
O-Open to new experiences, complex .01 .00 .00 .72 .05<br />
(Abierto a nuevas experiencias,<br />
complejo)<br />
O-Conventional, uncreative<br />
.04 .08 .12 .47 .06<br />
(Convencional, poco creativo)<br />
A-Critical, quarrelsome (Que critica a los<br />
demás, conflictivo)<br />
.14 .19 .03 .02 .65<br />
Note: In paren<strong>the</strong>sis are <strong>the</strong> TIPI items translated into Spanish. Loadings above .40<br />
have been highlighted in bold.<br />
Finally, <strong>the</strong> nomological network <strong>of</strong> <strong>the</strong> constructs measured by<br />
<strong>the</strong> TIPI was studied by examining <strong>the</strong>ir correlations <strong>with</strong> variables<br />
that had previously been related to <strong>personality</strong> <strong>traits</strong>.<br />
Table 4 shows both <strong>the</strong> zero-order correlations and correlations<br />
corrected for unreliability. Positive Affect is seen to have <strong>the</strong> highest<br />
correlation <strong>with</strong> Extraversion and Negative Affect has <strong>the</strong> highest<br />
correlation <strong>with</strong> Neuroticism. Satisfaction <strong>with</strong> Life shows<br />
significant but more moderate correlations <strong>with</strong> all <strong>traits</strong> but does<br />
not appear to have a particularly strong link to any specific trait.<br />
Regarding <strong>the</strong> magnitude <strong>of</strong> correlations, <strong>the</strong> average uncorrected<br />
correlation between <strong>the</strong> TIPI <strong>scales</strong> and SWB was .16, while<br />
<strong>the</strong> average corrected correlation was .26. The lowest correlation<br />
was that <strong>of</strong> Agreeableness and Positive Affect (.06 uncorrected or<br />
.11 corrected). The highest correlations were found between Extraversion<br />
and Positive Affect (.27 uncorrected or .42 corrected) and<br />
especially between Emotional Stability and Negative Affect ( .51<br />
uncorrected or .72 corrected). In general, <strong>the</strong> Emotional Stability<br />
and Extraversion <strong>scales</strong> showed <strong>the</strong> greatest correlation <strong>with</strong> SWB:<br />
<strong>with</strong> average correlations <strong>of</strong> .30 (.44 corrected) for Emotional<br />
Stability and .18 (.28 corrected) for Extraversion. Openness and<br />
Conscientiousness displayed <strong>the</strong> weakest correlation <strong>with</strong> SWB;<br />
both had an average correlation <strong>of</strong> .10 (.17 corrected).<br />
Extraversion, Conscientiousness and Openness were <strong>the</strong> dimensions<br />
most strongly related to Risk-Taking, which is clearly consistent<br />
<strong>with</strong> results from studies on risky behaviors (e.g. Romero<br />
Please cite this article in press as: Romero, E., et al. <strong>Measuring</strong> <strong>personality</strong> <strong>traits</strong> <strong>with</strong> <strong>ultra</strong>-<strong>short</strong> <strong>scales</strong>: A <strong>study</strong> <strong>of</strong> <strong>the</strong> Ten Item Personality Inventory (TIPI)<br />
in a Spanish sample. Personality and Individual Differences (2012), http://dx.doi.org/10.1016/j.paid.2012.03.035