Newberg Dundee Bypass Tier 2 Draft Environmental Impact Statement
Newberg Dundee Bypass Tier 2 Draft Environmental Impact Statement
Newberg Dundee Bypass Tier 2 Draft Environmental Impact Statement
Create successful ePaper yourself
Turn your PDF publications into a flip-book with our unique Google optimized e-Paper software.
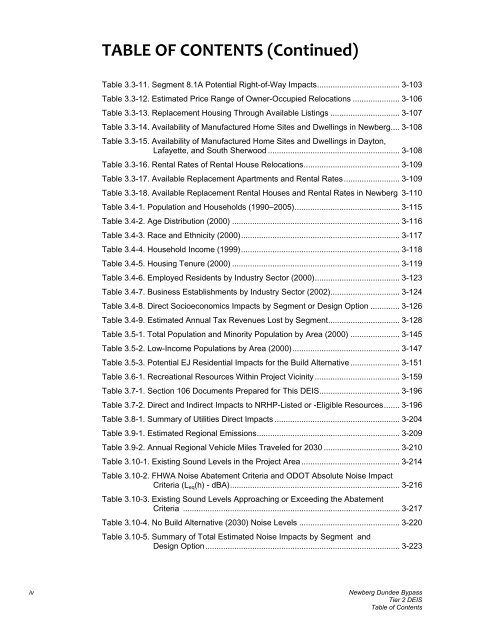
TABLE OF CONTENTS (Continued)<br />
Table 3.3-11. Segment 8.1A Potential Right-of-Way <strong>Impact</strong>s ..................................... 3-103<br />
Table 3.3-12. Estimated Price Range of Owner-Occupied Relocations ..................... 3-106<br />
Table 3.3-13. Replacement Housing Through Available Listings ............................... 3-107<br />
Table 3.3-14. Availability of Manufactured Home Sites and Dwellings in <strong>Newberg</strong> .... 3-108<br />
Table 3.3-15. Availability of Manufactured Home Sites and Dwellings in Dayton,<br />
Lafayette, and South Sherwood ........................................................... 3-108<br />
Table 3.3-16. Rental Rates of Rental House Relocations ........................................... 3-109<br />
Table 3.3-17. Available Replacement Apartments and Rental Rates ......................... 3-109<br />
Table 3.3-18. Available Replacement Rental Houses and Rental Rates in <strong>Newberg</strong> 3-110<br />
Table 3.4-1. Population and Households (1990–2005)............................................... 3-115<br />
Table 3.4-2. Age Distribution (2000) ........................................................................... 3-116<br />
Table 3.4-3. Race and Ethnicity (2000) ....................................................................... 3-117<br />
Table 3.4-4. Household Income (1999) ....................................................................... 3-118<br />
Table 3.4-5. Housing Tenure (2000) ........................................................................... 3-119<br />
Table 3.4-6. Employed Residents by Industry Sector (2000) ...................................... 3-123<br />
Table 3.4-7. Business Establishments by Industry Sector (2002) ............................... 3-124<br />
Table 3.4-8. Direct Socioeconomics <strong>Impact</strong>s by Segment or Design Option ............. 3-126<br />
Table 3.4-9. Estimated Annual Tax Revenues Lost by Segment ................................ 3-128<br />
Table 3.5-1. Total Population and Minority Population by Area (2000) ...................... 3-145<br />
Table 3.5-2. Low-Income Populations by Area (2000) ................................................ 3-147<br />
Table 3.5-3. Potential EJ Residential <strong>Impact</strong>s for the Build Alternative ...................... 3-151<br />
Table 3.6-1. Recreational Resources Within Project Vicinity ...................................... 3-159<br />
Table 3.7-1. Section 106 Documents Prepared for This DEIS .................................... 3-196<br />
Table 3.7-2. Direct and Indirect <strong>Impact</strong>s to NRHP-Listed or -Eligible Resources ....... 3-196<br />
Table 3.8-1. Summary of Utilities Direct <strong>Impact</strong>s ........................................................ 3-204<br />
Table 3.9-1. Estimated Regional Emissions ................................................................ 3-209<br />
Table 3.9-2. Annual Regional Vehicle Miles Traveled for 2030 .................................. 3-210<br />
Table 3.10-1. Existing Sound Levels in the Project Area ............................................ 3-214<br />
Table 3.10-2. FHWA Noise Abatement Criteria and ODOT Absolute Noise <strong>Impact</strong><br />
Criteria (L eq (h) - dBA) ............................................................................ 3-216<br />
Table 3.10-3. Existing Sound Levels Approaching or Exceeding the Abatement<br />
Criteria ................................................................................................. 3-217<br />
Table 3.10-4. No Build Alternative (2030) Noise Levels ............................................. 3-220<br />
Table 3.10-5. Summary of Total Estimated Noise <strong>Impact</strong>s by Segment and<br />
Design Option ....................................................................................... 3-223<br />
iv<br />
<strong>Newberg</strong> <strong>Dundee</strong> <strong>Bypass</strong><br />
<strong>Tier</strong> 2 DEIS<br />
Table of Contents


