1 - DePa
1 - DePa
1 - DePa

Create successful ePaper yourself
Turn your PDF publications into a flip-book with our unique Google optimized e-Paper software.
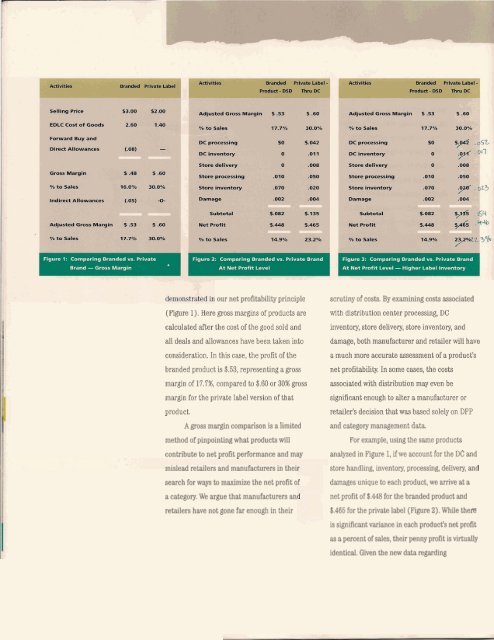
our net profitability principle<br />
(Figure 1). Here gross margins of products are<br />
calculated after the cost of the good sold and<br />
al1 deals and allowances have been taken into<br />
consideration. In this case, the profit of the<br />
branded product is $.53, representing a gross<br />
margin of 17.796, compared to $.60 or 30% gross<br />
margin for the private label version of that<br />
product.<br />
A gross margin comparison is a limited<br />
method of pinpointing what products will<br />
contribute to net profit performance and may<br />
mislead retailers and manufacturen in thei<br />
search for ways to maximize the net profit of<br />
a category. We argue that manufacturen an<br />
retailers have not gone far enough in their<br />
scrutiny of costs. By examining costs associated<br />
with distribution center processing, DC<br />
inventory, store delivery, store inventory, and<br />
damage, both manufacturer and retailer will have<br />
a much more accurate assessment of a product's<br />
net profitability, In some cases, the costs<br />
associated with distribution may even be<br />
significant enough to alter a manufacturer or<br />
retailer's decision that was based solely on DPP<br />
and category management data.<br />
For example, using the same products<br />
analyzed in Figure 1, if we account for the DC and<br />
store handling, inventory, processing, delivery, and<br />
damages unique to each product, we arrive at a<br />
net profit of $.448 for the branded product and<br />
6.465 for the private label (Figure 2). While thefe<br />
is significant variance in each product's net profit<br />
as a percent of sales, their penny profit is virtually<br />
identical. Given the new data regarding


![Síntesis de los isómeros de enlace [Co(NH3)5(ONO)]Cl2 y - DePa](https://img.yumpu.com/16368707/1/190x245/sintesis-de-los-isomeros-de-enlace-conh35onocl2-y-depa.jpg?quality=85)