Water quality evaluation in Mediterranean lagoons using the ...
Water quality evaluation in Mediterranean lagoons using the ...
Water quality evaluation in Mediterranean lagoons using the ...

You also want an ePaper? Increase the reach of your titles
YUMPU automatically turns print PDFs into web optimized ePapers that Google loves.
TWB 7 (2013), n. 1<br />
A.M. Bazzoni, S. Pul<strong>in</strong>a, B.M. Padedda, C.T. Satta, A. Lugliè, N. Sechi, C. Facca<br />
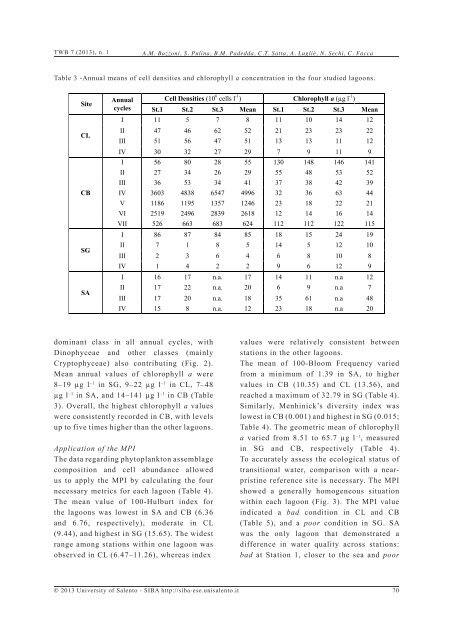
Table 3 -Annual means of cell densities and chlorophyll a concentration <strong>in</strong> <strong>the</strong> four studied <strong>lagoons</strong>.<br />
Site<br />
CL<br />
CB<br />
SG<br />
SA<br />
Annual<br />
cycles<br />
Cell Densities (10 6 cells l -1 ) Chlorophyll a (µg l -1 )<br />
St.1 St.2 St.3 Mean St.1 St.2 St.3 Mean<br />
I 11 5 7 8 11 10 14 12<br />
II 47 46 62 52 21 23 23 22<br />
III 51 56 47 51 13 13 11 12<br />
IV 30 32 27 29 7 9 11 9<br />
I 56 80 28 55 130 148 146 141<br />
II 27 34 26 29 55 48 53 52<br />
III 36 53 34 41 37 38 42 39<br />
IV 3603 4838 6547 4996 32 36 63 44<br />
V 1186 1195 1357 1246 23 18 22 21<br />
VI 2519 2496 2839 2618 12 14 16 14<br />
VII 526 663 683 624 112 112 122 115<br />
I 86 87 84 85 18 15 24 19<br />
II 7 1 8 5 14 5 12 10<br />
III 2 3 6 4 6 8 10 8<br />
IV 1 4 2 2 9 6 12 9<br />
I 16 17 n.a. 17 14 11 n.a 12<br />
II 17 22 n.a. 20 6 9 n.a 7<br />
III 17 20 n.a. 18 35 61 n.a 48<br />
IV 15 8 n.a. 12 23 18 n.a 20<br />
dom<strong>in</strong>ant class <strong>in</strong> all annual cycles, with<br />
D<strong>in</strong>ophyceae and o<strong>the</strong>r classes (ma<strong>in</strong>ly<br />
Cryptophyceae) also contribut<strong>in</strong>g (Fig. 2).<br />
Mean annual values of chlorophyll a were<br />
8–19 µg l –1 <strong>in</strong> SG, 9–22 µg l –1 <strong>in</strong> CL, 7–48<br />
µg l –1 <strong>in</strong> SA, and 14–141 µg l –1 <strong>in</strong> CB (Table<br />
3). Overall, <strong>the</strong> highest chlorophyll a values<br />
were consistently recorded <strong>in</strong> CB, with levels<br />
up to five times higher than <strong>the</strong> o<strong>the</strong>r <strong>lagoons</strong>.<br />
Application of <strong>the</strong> MPI<br />
The data regard<strong>in</strong>g phytoplankton assemblage<br />
composition and cell abundance allowed<br />
us to apply <strong>the</strong> MPI by calculat<strong>in</strong>g <strong>the</strong> four<br />
necessary metrics for each lagoon (Table 4).<br />
The mean value of 100-Hulburt <strong>in</strong>dex for<br />
<strong>the</strong> <strong>lagoons</strong> was lowest <strong>in</strong> SA and CB (6.36<br />
and 6.76, respectively), moderate <strong>in</strong> CL<br />
(9.44), and highest <strong>in</strong> SG (15.65). The widest<br />
range among stations with<strong>in</strong> one lagoon was<br />
observed <strong>in</strong> CL (6.47–11.26), whereas <strong>in</strong>dex<br />
values were relatively consistent between<br />
stations <strong>in</strong> <strong>the</strong> o<strong>the</strong>r <strong>lagoons</strong>.<br />
The mean of 100-Bloom Frequency varied<br />
from a m<strong>in</strong>imum of 1.39 <strong>in</strong> SA, to higher<br />
values <strong>in</strong> CB (10.35) and CL (13.56), and<br />
reached a maximum of 32.79 <strong>in</strong> SG (Table 4).<br />
Similarly, Menh<strong>in</strong>ick’s diversity <strong>in</strong>dex was<br />
lowest <strong>in</strong> CB (0.001) and highest <strong>in</strong> SG (0.015;<br />
Table 4). The geometric mean of chlorophyll<br />
a varied from 8.51 to 65.7 µg l –1 , measured<br />
<strong>in</strong> SG and CB, respectively (Table 4).<br />
To accurately assess <strong>the</strong> ecological status of<br />
transitional water, comparison with a nearprist<strong>in</strong>e<br />
reference site is necessary. The MPI<br />
showed a generally homogeneous situation<br />
with<strong>in</strong> each lagoon (Fig. 3). The MPI value<br />
<strong>in</strong>dicated a bad condition <strong>in</strong> CL and CB<br />
(Table 5), and a poor condition <strong>in</strong> SG. SA<br />
was <strong>the</strong> only lagoon that demonstrated a<br />
difference <strong>in</strong> water <strong>quality</strong> across stations:<br />
bad at Station 1, closer to <strong>the</strong> sea and poor<br />
© 2013 University of Salento - SIBA http://siba-ese.unisalento.it 70