Socioeconomic Roots of Middle East Radicalism
Socioeconomic Roots of Middle East Radicalism
Socioeconomic Roots of Middle East Radicalism

Create successful ePaper yourself
Turn your PDF publications into a flip-book with our unique Google optimized e-Paper software.
26 NAVAL WAR COLLEGE REVIEW<br />
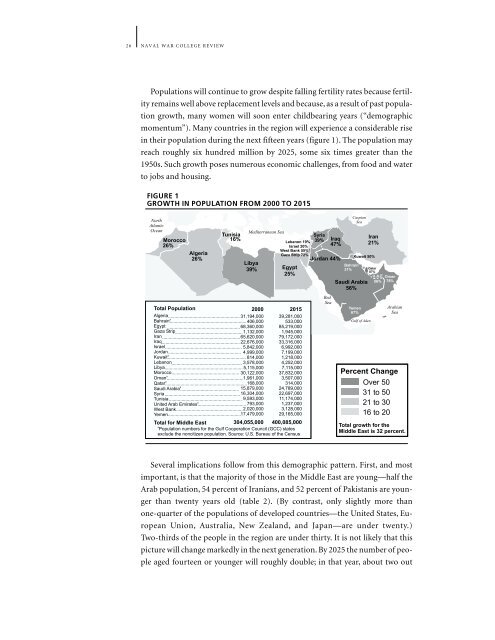
Populations will continue to grow despite falling fertility rates because fertility<br />
remains well above replacement levels and because, as a result <strong>of</strong> past population<br />
growth, many women will soon enter childbearing years (“demographic<br />
momentum”). Many countries in the region will experience a considerable rise<br />
in their population during the next fifteen years (figure 1). The population may<br />
reach roughly six hundred million by 2025, some six times greater than the<br />
1950s. Such growth poses numerous economic challenges, from food and water<br />
to jobs and housing.<br />
FIGURE 1<br />
GROWTH IN POPULATION FROM 2000 TO 2015<br />
North<br />
Atlantic<br />
Ocean<br />
Morocco<br />
26%<br />
Algeria<br />
26%<br />
Tunisia<br />
16%<br />
Mediterranean Sea<br />
Lebanon 19%<br />
Israel 20%<br />
West Bank 55%<br />
Gaza Strip 72%<br />
Libya<br />
39% Egypt<br />
25%<br />
Total Population 2000 2015<br />
Algeria........................................................<br />
31,194,000<br />
a<br />
Bahrain............................................................<br />
406,000<br />
39,281,000<br />
533,000<br />
Egypt ......................................................... 68,360,000<br />
Gaza Strip.....................................................<br />
1,132,000<br />
Iran ............................................................. 65,620,000<br />
Iraq.............................................................<br />
22,676,000<br />
Israel............................................................<br />
5,842,000<br />
Jordan.........................................................<br />
4,999,000<br />
a<br />
Kuwait.............................................................<br />
814,000<br />
85,219,000<br />
1,945,000<br />
79,172,000<br />
33,316,000<br />
6,992,000<br />
7,199,000<br />
1,218,000<br />
Lebanon.......................................................<br />
3,578,000<br />
Libya.............................................................<br />
5,115,000<br />
Morocco.....................................................<br />
30,122,000<br />
a<br />
Oman............................................................<br />
1,961,000<br />
4,252,000<br />
7,115,000<br />
37,832,000<br />
3,507,000<br />
a<br />
Qatar................................................................<br />
168,000 314,000<br />
a<br />
Saudi Arabia..............................................<br />
15,879,000 24,789,000<br />
Syria...........................................................<br />
16,304,000<br />
Tunisia ......................................................... 9,593,000<br />
a<br />
United Arab Emirates......................................<br />
793,000<br />
22,697,000<br />
11,174,000<br />
1,237,000<br />
West Bank....................................................<br />
2,020,000<br />
Yemen.........................................................<br />
17,479,000<br />
3,128,000<br />
29,165,000<br />
Total for <strong>Middle</strong> <strong>East</strong> 304,055,000 400,085,000<br />
a<br />
Population numbers for the Gulf Cooperation Council (GCC) states<br />
exclude the noncitizen population. Source: U.S. Bureau <strong>of</strong> the Census<br />
Syria<br />
39% Iraq<br />
47%<br />
Jordan 44%<br />
Red<br />
Sea<br />
Bahrain<br />
31%<br />
Caspian<br />
Sea<br />
Kuwait 50%<br />
Saudi Arabia<br />
56%<br />
Yemen<br />
67%<br />
Gulf <strong>of</strong> Aden<br />
Iran<br />
21%<br />
Qatar<br />
87%<br />
U.A.E Oman<br />
56% 78%<br />
Arabian<br />
Sea<br />
Percent Change<br />
Over 50<br />
31 to 50<br />
21 to 30<br />
16 to 20<br />
Total growth for the<br />
<strong>Middle</strong> <strong>East</strong> is 32 percent.<br />
Several implications follow from this demographic pattern. First, and most<br />
important, is that the majority <strong>of</strong> those in the <strong>Middle</strong> <strong>East</strong> are young—half the<br />
Arab population, 54 percent <strong>of</strong> Iranians, and 52 percent <strong>of</strong> Pakistanis are younger<br />
than twenty years old (table 2). (By contrast, only slightly more than<br />
one-quarter <strong>of</strong> the populations <strong>of</strong> developed countries—the United States, European<br />
Union, Australia, New Zealand, and Japan—are under twenty.)<br />
Two-thirds <strong>of</strong> the people in the region are under thirty. It is not likely that this<br />
picture will change markedly in the next generation. By 2025 the number <strong>of</strong> people<br />
aged fourteen or younger will roughly double; in that year, about two out