Grade 2 - California Department of Education
Grade 2 - California Department of Education
Grade 2 - California Department of Education

You also want an ePaper? Increase the reach of your titles
YUMPU automatically turns print PDFs into web optimized ePapers that Google loves.
State Board <strong>of</strong> <strong>Education</strong>-Adopted <strong>Grade</strong> Two Page 35 <strong>of</strong> 45<br />
567<br />
568<br />
569<br />
570<br />
571<br />
572<br />
573<br />
574<br />
575<br />
576<br />
577<br />
578<br />
579<br />
In first grade, students worked with three categories <strong>of</strong> data. In second grade,<br />
students represent data on a picture graph or bar graph (with single-unit scale)<br />
and interpret the results. Students organize, represent, and interpret data with up<br />
to four categories. In second grade, picture graphs (pictographs) use symbols<br />
that represent single units. Pictographs should include a title, categories,<br />
category label, key, and data.<br />
Students use data to pose and solve simple one-step addition and subtraction<br />
problems. The use <strong>of</strong> picture graphs and bar graphs to represent a data set<br />
(2.MD.D.10) reinforces major work at the grade in the cluster “Represent and<br />
solve problems involving addition and subtraction” and provides a context for<br />
students to solve related addition and subtraction problems (2.OA.A.1▲).<br />
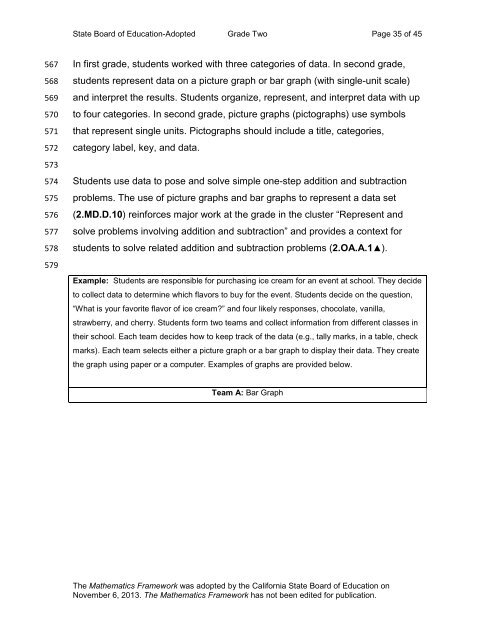
Example: Students are responsible for purchasing ice cream for an event at school. They decide<br />
to collect data to determine which flavors to buy for the event. Students decide on the question,<br />
“What is your favorite flavor <strong>of</strong> ice cream?” and four likely responses, chocolate, vanilla,<br />
strawberry, and cherry. Students form two teams and collect information from different classes in<br />
their school. Each team decides how to keep track <strong>of</strong> the data (e.g., tally marks, in a table, check<br />
marks). Each team selects either a picture graph or a bar graph to display their data. They create<br />
the graph using paper or a computer. Examples <strong>of</strong> graphs are provided below.<br />
Team A: Bar Graph<br />
The Mathematics Framework was adopted by the <strong>California</strong> State Board <strong>of</strong> <strong>Education</strong> on<br />
November 6, 2013. The Mathematics Framework has not been edited for publication.