Newfoundland and Labrador Targeted Gambling Prevalence Study ...
Newfoundland and Labrador Targeted Gambling Prevalence Study ...
Newfoundland and Labrador Targeted Gambling Prevalence Study ...
You also want an ePaper? Increase the reach of your titles
YUMPU automatically turns print PDFs into web optimized ePapers that Google loves.
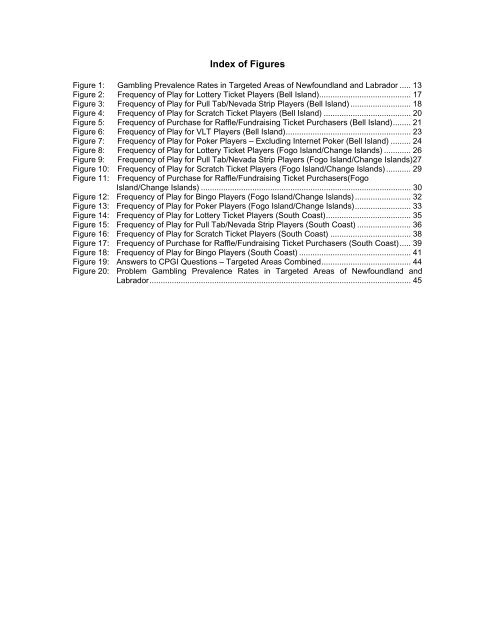
Index of Figures<br />
Figure 1: <strong>Gambling</strong> <strong>Prevalence</strong> Rates in <strong>Targeted</strong> Areas of <strong>Newfoundl<strong>and</strong></strong> <strong>and</strong> <strong>Labrador</strong> ..... 13<br />
Figure 2: Frequency of Play for Lottery Ticket Players (Bell Isl<strong>and</strong>)......................................... 17<br />
Figure 3: Frequency of Play for Pull Tab/Nevada Strip Players (Bell Isl<strong>and</strong>) ........................... 18<br />
Figure 4: Frequency of Play for Scratch Ticket Players (Bell Isl<strong>and</strong>) ....................................... 20<br />
Figure 5: Frequency of Purchase for Raffle/Fundraising Ticket Purchasers (Bell Isl<strong>and</strong>)........ 21<br />
Figure 6: Frequency of Play for VLT Players (Bell Isl<strong>and</strong>)........................................................ 23<br />
Figure 7: Frequency of Play for Poker Players – Excluding Internet Poker (Bell Isl<strong>and</strong>) ......... 24<br />
Figure 8: Frequency of Play for Lottery Ticket Players (Fogo Isl<strong>and</strong>/Change Isl<strong>and</strong>s) ............ 26<br />
Figure 9: Frequency of Play for Pull Tab/Nevada Strip Players (Fogo Isl<strong>and</strong>/Change Isl<strong>and</strong>s)27<br />
Figure 10: Frequency of Play for Scratch Ticket Players (Fogo Isl<strong>and</strong>/Change Isl<strong>and</strong>s)........... 29<br />
Figure 11: Frequency of Purchase for Raffle/Fundraising Ticket Purchasers(Fogo<br />
Isl<strong>and</strong>/Change Isl<strong>and</strong>s) .............................................................................................. 30<br />
Figure 12: Frequency of Play for Bingo Players (Fogo Isl<strong>and</strong>/Change Isl<strong>and</strong>s) ......................... 32<br />
Figure 13: Frequency of Play for Poker Players (Fogo Isl<strong>and</strong>/Change Isl<strong>and</strong>s)......................... 33<br />
Figure 14: Frequency of Play for Lottery Ticket Players (South Coast)...................................... 35<br />
Figure 15: Frequency of Play for Pull Tab/Nevada Strip Players (South Coast) ........................ 36<br />
Figure 16: Frequency of Play for Scratch Ticket Players (South Coast) .................................... 38<br />
Figure 17: Frequency of Purchase for Raffle/Fundraising Ticket Purchasers (South Coast)..... 39<br />
Figure 18: Frequency of Play for Bingo Players (South Coast) .................................................. 41<br />
Figure 19: Answers to CPGI Questions – <strong>Targeted</strong> Areas Combined........................................ 44<br />
Figure 20: Problem <strong>Gambling</strong> <strong>Prevalence</strong> Rates in <strong>Targeted</strong> Areas of <strong>Newfoundl<strong>and</strong></strong> <strong>and</strong><br />
<strong>Labrador</strong>..................................................................................................................... 45


