Predictive models of whitebark pine mortality from mountain pine ...
Predictive models of whitebark pine mortality from mountain pine ...
Predictive models of whitebark pine mortality from mountain pine ...

Create successful ePaper yourself
Turn your PDF publications into a flip-book with our unique Google optimized e-Paper software.
502 D.L. Perkins, D.W. Roberts / Forest Ecology and Management 174 (2003) 495–510<br />
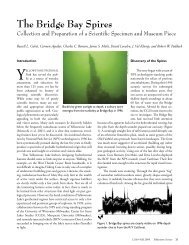
Fig. 2. Whitebark <strong>pine</strong> least square regression <strong>of</strong> diameter classes<br />
ca. 1930 against diameters in 1998.<br />
(Table 1). Attacked and non-attacked paired stands<br />
were located adjacent to each other for stands ABK<br />
and AND, BLK and BLP, and AVL and CRS. Stands<br />
ASO and BGH and RRB and NRR were also paired<br />
but were separated by a ridge and not adjacent (Fig. 1).<br />
For the 14 stands sampled, we found clear differences<br />
in structure between non-attacked versus<br />
attacked stands Table 3. Basal area (ba30), trees per<br />
hectare (tph30), mean basal area (mba30), quadratic<br />
Table 3<br />
Stand summary metrics ca. 1930 a<br />
Site ba30 b tph30 c mba30 d dq30 e sdi30 f babk g tphbk h<br />
NRR 3.4 178 0.02 15 33 0 0<br />
BLP 3.9 195 0.02 16 38 0 0<br />
ASO 4.6 27 0.17 46 30 0 0<br />
CRS 5.1 210 0.02 18 47 0 0<br />
AND 6.7 289 0.02 17 63 0 0<br />
ABK 13.1 403 0.03 20 114 12.2 338<br />
SIL 14.0 272 0.05 26 111 11.5 188<br />
AVL 16.3 356 0.05 24 132 10.6 143<br />
TLK 16.5 195 0.21 33 119 14.7 101<br />
GOA 18.4 124 0.15 44 119 16.8 59<br />
TWP 21.6 257 0.08 33 156 20.4 183<br />
BLK 26.4 316 0.08 33 190 25.3 249<br />
BGH 32.1 479 0.07 29 242 30.3 380<br />
RRB 50.3 889 0.05 27 393 46.8 734<br />
a The first five rows are stands that were not attacked by<br />
<strong>mountain</strong> <strong>pine</strong> beetle and the last nine rows were attacked stands.<br />
b Basal area (m 2 /ha).<br />
c Trees per hectare.<br />
d Mean basal area.<br />
e Quadratic mean diameter (cm).<br />
f Stand density index.<br />
g Basal area <strong>of</strong> trees killed by <strong>mountain</strong> <strong>pine</strong> beetles.<br />
h Trees killed by <strong>mountain</strong> <strong>pine</strong> beetles per hectare.<br />
mean diameter (dq30) and stand density index (sdi30)<br />
before the outbreak were lower on unattacked as<br />
compared to attacked stands (Table 3). Non-attacked<br />
stands were composed <strong>of</strong> smaller, younger trees at<br />
lower densities than attacked stands. On attacked<br />
stands, approximately 60–400 trees/ha were killed<br />
by <strong>mountain</strong> <strong>pine</strong> beetles. Site RRB was small (only<br />
three plots) and the <strong>mortality</strong> estimate <strong>of</strong> 734 trees/ha<br />
is possibly too high. No beetle-killed trees were<br />
recorded in sample plots on non-attacked stands.<br />
Whitebark <strong>pine</strong> identified as dead by unknown cause;<br />
recent beetle-kill (within 10 years); or older than ca<br />
1930s epidemic; represented 0.12% <strong>of</strong> all <strong>whitebark</strong><br />
<strong>pine</strong> sampled and 5.6% <strong>of</strong> dead <strong>whitebark</strong> <strong>pine</strong><br />
sampled.<br />
The implication <strong>of</strong> having paired stands is that they<br />
generally experienced the same beetle pressure and<br />
that structural rather than environmental site variables<br />
would differentiate susceptibility. This was shown<br />
with basal area (ba30) and stand density index<br />
(sdi30) as the only significant predictors in logistic<br />
regression <strong>models</strong>. None <strong>of</strong> the site variables contributed<br />
to predicting attack. However because the outcome<br />
<strong>of</strong> a stand being attacked or not attacked was<br />
split perfectly by basal area or SDI, the odds ratio was<br />
undefined and we do not present a logistic regression<br />
model. Whitebark <strong>pine</strong> stands with basal areas above<br />
10 m 2 /ha (44 ft 2 /acre) and SDI above 80 (Fig. 3) had a<br />
100% probability <strong>of</strong> being attacked in either model.<br />
The probability <strong>of</strong> correctly predicting 14 out <strong>of</strong> 14<br />
stands, with 9 out <strong>of</strong> 14 attacked is 0.002 calculated<br />
using the probability mass function <strong>of</strong> a binomial<br />
random variable (Ross, 1976).<br />
3.2. Tree-level model<br />
Analyses <strong>of</strong> the pooled tree-level data set identified<br />
four significant ðp < 0:001Þ independent variables:<br />
diameter ca. 1930 (dbh30), basal area per 0.04 ha<br />
ca. 1930 (baplt30), trees per 0.04 ha ca. 1930 (tplt30),<br />
and number <strong>of</strong> stems in a tree cluster (nstms). As in the<br />
stand-level model, none <strong>of</strong> the recorded environmental<br />
site variables (aspect, elevation, and slope) was significant.<br />
Analyses <strong>of</strong> deviance <strong>of</strong> the model predictors<br />
with the w 2 test statistic (Venables and Ripley, 1999)<br />
demonstrated statistical significance ðp < 0:001Þ for<br />
all four variables in the 10-fold cross-validation <strong>models</strong>.<br />
Results <strong>from</strong> cross-validation <strong>models</strong> were cross-