Teacher turnover in special and general education: attrition
Teacher turnover in special and general education: attrition
Teacher turnover in special and general education: attrition

Create successful ePaper yourself
Turn your PDF publications into a flip-book with our unique Google optimized e-Paper software.
<strong>Teacher</strong> Turnover<br />
TEACHER TURNOVER IN SPECIAL AND GENERAL EDUCATION:<br />
ATTRITION, TEACHING AREA TRANSFER, AND SCHOOL MIGRATION 1,2<br />
Erl<strong>in</strong>g E. Boe, Ph.D.<br />
Professor of Education<br />
Graduate School of Education<br />
University of Pennsylvania<br />
Lynne H. Cook, Ph.D.<br />
Professor of Special Education<br />
Department of Special Education<br />
California State University, Northridge<br />
<strong>and</strong><br />
Robert J. Sunderl<strong>and</strong>, M.S.<br />
Research Associate<br />
Graduate School of Education<br />
University of Pennsylvania<br />
Research Report No. 2006-TSDQ3<br />
Center for Research <strong>and</strong> Evaluation <strong>in</strong> Social Policy<br />
Graduate School of Education<br />
University of Pennsylvania<br />
Philadelphia, PA 19104<br />
Revised: August 15, 2007<br />
1 Support for this research was provided by a grant (Award Number H0324C020002) from the Research <strong>and</strong><br />
Innovation to Improve Services <strong>and</strong> Results for Children with Disabilities Program (Field Initiated Research<br />
Projects, CFDA Number: 84-024C), Research to Practice Division, Office of Special Education Programs,<br />
the U.S. Department of Education, to Erl<strong>in</strong>g E. Boe at the University of Pennsylvania; <strong>and</strong> by the Center for<br />
Research <strong>and</strong> Evaluation <strong>in</strong> Social Policy, the Graduate School of Education of the University of<br />
Pennsylvania.<br />
B&cm\rr3-mss6.doc
<strong>Teacher</strong> Turnover<br />
Abstract<br />
<strong>Teacher</strong> <strong>turnover</strong> is a major concern because of the dem<strong>and</strong> it creates for replacement<br />
teachers along with its organizational <strong>and</strong> f<strong>in</strong>ancial costs. Accord<strong>in</strong>gly, the purposes of this<br />
research were to quantify trends <strong>in</strong> three components of teacher <strong>turnover</strong> (<strong>attrition</strong>, teach<strong>in</strong>g area<br />
transfer, <strong>and</strong> school migration) <strong>in</strong> public schools nationally for <strong>special</strong> <strong>and</strong> <strong>general</strong> <strong>education</strong>,<br />
<strong>and</strong> to <strong>in</strong>vestigate claims of excessive teacher <strong>turnover</strong> as the predom<strong>in</strong>ant source of teacher<br />
shortages. Attrition <strong>and</strong> teach<strong>in</strong>g area transfer rates were comparable <strong>in</strong> <strong>special</strong> <strong>and</strong> <strong>general</strong><br />
<strong>education</strong>, <strong>and</strong> <strong>in</strong>creased substantially <strong>in</strong> both fields from 1991-02 to 2000-01. School migration<br />
was stable over years, but higher <strong>in</strong> <strong>special</strong> than <strong>general</strong> <strong>education</strong>. Overall, annual <strong>turnover</strong> (all<br />
three components comb<strong>in</strong>ed) was high <strong>and</strong> <strong>in</strong>creased to one <strong>in</strong> four teachers (25.6%) by 2000-01.<br />
Nevertheless, teacher <strong>attrition</strong> was lower than <strong>in</strong> other occupations. Available evidence <strong>in</strong>dicates<br />
that teacher <strong>attrition</strong>, per se, has not been excessively high nationally. Therefore, retention is<br />
unlikely to <strong>in</strong>crease unless dramatic improvements are made <strong>in</strong> the organization, management,<br />
<strong>and</strong> fund<strong>in</strong>g of public schools. Until then, <strong>in</strong>creased supply of qualified teachers is needed to<br />
reduce teacher shortages.<br />
2
<strong>Teacher</strong> Turnover<br />
Introduction<br />
Dur<strong>in</strong>g the past decade or so, teacher <strong>turnover</strong> has become a major concern <strong>in</strong> <strong>education</strong>al<br />
research <strong>and</strong> policy analysis because of the dem<strong>and</strong> it creates for replacement teachers [National<br />
Commission on Teach<strong>in</strong>g <strong>and</strong> America’s Future (NCTAF), 2003; Kozleski, Ma<strong>in</strong>zer, & Deshler,<br />
2000; Johnson, Berg, & Donaldson, 2005]. This concern is dramatized by NCTAF’s assertion<br />
that “<strong>Teacher</strong> Retention Has Become a National Crisis” (p. 21), mean<strong>in</strong>g that <strong>in</strong>adequate<br />
retention (i.e., excessive <strong>turnover</strong>) has become a crisis. Others have endorsed this perspective,<br />
<strong>and</strong> stated that the apparent shortage of teachers is due to exceptionally high dem<strong>and</strong> created by<br />
an excessive rate of <strong>turnover</strong>, <strong>in</strong>stead of due to <strong>in</strong>sufficient supply. In this sense, teacher shortage<br />
is said to be a myth because it is claimed that the supply of teachers is adequate (Ingersoll, 1997;<br />
NCTAF, 2003; Podgursky, 2006). This perspective does not have wide support because teacher<br />
shortage is commonly viewed as an imbalance between supply <strong>and</strong> dem<strong>and</strong> (e.g., Curran &<br />
Abrahams, 2000; Boe & Gilford, 2002). Accord<strong>in</strong>gly, the ma<strong>in</strong> purposes of this research were to<br />
quantify trends <strong>in</strong> teacher <strong>turnover</strong> phenomena nationally <strong>in</strong> <strong>special</strong> <strong>and</strong> <strong>general</strong> <strong>education</strong>, <strong>and</strong> to<br />
<strong>in</strong>vestigate claims of excessive teacher <strong>turnover</strong> as the predom<strong>in</strong>ant source of teacher shortages.<br />
<strong>Teacher</strong> <strong>turnover</strong> refers to major changes <strong>in</strong> a teacher’s assignment from one school year to<br />
the next. Turnover <strong>in</strong>cludes three components, the most studied of which are leav<strong>in</strong>g teach<strong>in</strong>g<br />
employment (commonly referred to as <strong>attrition</strong>) <strong>and</strong> mov<strong>in</strong>g to a different school (commonly<br />
referred to as school transfer or as teacher migration). A third, but neglected, component is<br />
teach<strong>in</strong>g area transfer, such as the transfer of a teacher from an assignment <strong>in</strong> <strong>special</strong> <strong>education</strong><br />
to one <strong>in</strong> <strong>general</strong> <strong>education</strong>. This has been of particular concern to the field of <strong>special</strong> <strong>education</strong><br />
(Kozleski, et al., 2000), but has been little studied.<br />
The results of research on teacher <strong>turnover</strong> have been used to support advocacy for farreach<strong>in</strong>g<br />
changes <strong>in</strong> <strong>education</strong>. At the policy level, NCTAF (2003) recommended downsiz<strong>in</strong>g<br />
schools, offer<strong>in</strong>g federal f<strong>in</strong>ancial <strong>in</strong>centives for attract<strong>in</strong>g teachers <strong>in</strong>to high shortage areas, <strong>and</strong><br />
higher teacher compensation, all of which are designed to reduce teacher <strong>turnover</strong>. Kozleski et<br />
al. (2000) recommended the preparation of sufficient numbers of teachers <strong>in</strong> <strong>special</strong> <strong>education</strong> to<br />
fill the dem<strong>and</strong> created by <strong>turnover</strong>. At the practice level, Kozleski et al. <strong>and</strong> Bill<strong>in</strong>gsley (2005)<br />
3
<strong>Teacher</strong> Turnover<br />
suggested a number of strategies <strong>in</strong>clud<strong>in</strong>g effective professional development <strong>and</strong> reasonable<br />
work assignments to enhance teacher retention. In view of this widespread use of research to<br />
advocate changes <strong>in</strong> policy <strong>and</strong> practice, it is important to have valid, comprehensive, <strong>and</strong> up-todate<br />
evidence about the <strong>turnover</strong> of both <strong>special</strong> <strong>education</strong> teachers (SETs) <strong>and</strong> <strong>general</strong> <strong>education</strong><br />
teachers (GETs). Yet, much is not known, <strong>and</strong> there are several fundamental issues with the<br />
report<strong>in</strong>g, <strong>in</strong>terpretation, <strong>and</strong> application of teacher <strong>turnover</strong> statistics, as reviewed below.<br />
Turnover Rates<br />
Even though the teach<strong>in</strong>g profession has been characterized as a revolv<strong>in</strong>g door (e.g.,<br />
Ingersoll, 2003; Hanushek, Ka<strong>in</strong>, & Rivk<strong>in</strong>, 2004), there is some uncerta<strong>in</strong>ty <strong>and</strong> confusion about<br />
the amount of <strong>turnover</strong> annually. It is surpris<strong>in</strong>g that two major recent reviews of research<br />
literature on teacher <strong>turnover</strong> <strong>and</strong> retention (Bill<strong>in</strong>gsley, 2004; Guar<strong>in</strong>o, Santibanez, & Daley,<br />
2006) did not address the amount of <strong>turnover</strong>. Instead, these reviews focused on factors related to<br />
<strong>turnover</strong> <strong>and</strong> retention. A third recent review (Johnson et al., 2005) cited some of the extensive<br />
data on teacher <strong>attrition</strong> <strong>and</strong> migration collected by the National Center for Education Statistics<br />
(NCES) as part of its periodic national-level <strong>Teacher</strong> Follow-Up Surveys (TFS). TFS is a highquality<br />
survey that def<strong>in</strong>es <strong>attrition</strong> <strong>and</strong> migration behaviorally by track<strong>in</strong>g changes <strong>in</strong> an<br />
<strong>in</strong>dividual teacher’s employment status from one-year-to-the-next, as dist<strong>in</strong>guished from simply<br />
ask<strong>in</strong>g teachers about their <strong>in</strong>tentions to rema<strong>in</strong> or leave <strong>in</strong> the future. Furthermore, the sample<br />
sizes are reasonably large, <strong>and</strong> the response rates are quite high (Luekens, Lyter, & Fox, 2004).<br />
Based on TFS data from school years 1999-00 to 2000-01, 7.4% of all public school<br />
teachers left teach<strong>in</strong>g employment, while another 7.7% moved to a different school—a total of<br />
15.1% at the school level for <strong>attrition</strong> <strong>and</strong> migration comb<strong>in</strong>ed (Luekens, et al., 2004).<br />
Contrasted with these statistics, an <strong>in</strong>fluential report on America’s teachers reported questionable<br />
or confus<strong>in</strong>g data of uncerta<strong>in</strong> orig<strong>in</strong> about teacher transitions (NCTAF, 2003). Accord<strong>in</strong>g to<br />
NCTAF, 30% of the national teach<strong>in</strong>g force was <strong>in</strong> transition at the school level dur<strong>in</strong>g the 1999-<br />
00 school year (15% be<strong>in</strong>g hired; 15% leav<strong>in</strong>g). In fact, however, only about 15% of the teach<strong>in</strong>g<br />
force was <strong>in</strong> transition, not the 30% claimed. This is because the 15% hired at the school level<br />
one year replaced the 15% that left after the prior school year. The rema<strong>in</strong><strong>in</strong>g 85% of the<br />
teach<strong>in</strong>g force rema<strong>in</strong>ed <strong>in</strong> the same school from one year to the next (Luekens, et al.). The<br />
source of NCTAF’s data is not known because the orig<strong>in</strong>al research cited (Ingersoll, 2001) did<br />
not <strong>in</strong>clude such <strong>in</strong>formation.<br />
4
<strong>Teacher</strong> Turnover<br />
Turnover of <strong>Teacher</strong>s <strong>in</strong> Special versus General Education<br />
Based on TFS data for the 1993-94 school year, Boe, Bobbitt, Cook, <strong>and</strong> Barkanic (1998)<br />
reported separate annual <strong>attrition</strong> percentages for SETs (6.3%) <strong>and</strong> GETs (6.6%). Contrasted<br />
with these statistics, a major report by the Council for Exceptional Children (Kozleski et al.,<br />
2000) stated that SETs leave the profession each year “at almost twice the rate of their <strong>general</strong><br />
<strong>education</strong> colleagues” (p. 7), without cit<strong>in</strong>g the source of this <strong>in</strong>formation. This statement is<br />
certa<strong>in</strong>ly at odds with national TFS <strong>attrition</strong> statistics for leav<strong>in</strong>g teach<strong>in</strong>g employment.<br />
However, Kozleski et al. may have meant that twice as many leave teach<strong>in</strong>g <strong>in</strong> <strong>special</strong> <strong>education</strong><br />
(i.e., the sum of <strong>attrition</strong> <strong>and</strong> transfers to <strong>general</strong> <strong>education</strong>) as leave teach<strong>in</strong>g <strong>in</strong> <strong>general</strong><br />
<strong>education</strong> (i.e., the sum of <strong>attrition</strong> <strong>and</strong> transfers to <strong>special</strong> <strong>education</strong>). In that case, TFS data for<br />
1994-95 demonstrated that about twice as many teachers left <strong>special</strong> <strong>education</strong> teach<strong>in</strong>g (15.3%)<br />
as left <strong>general</strong> <strong>education</strong> teach<strong>in</strong>g (7.0%) (Boe et al.). Regardless, depend<strong>in</strong>g on what was meant,<br />
the Kozleski et al. statement is either ambiguous or <strong>in</strong>correct.<br />
Attrition of Beg<strong>in</strong>n<strong>in</strong>g <strong>Teacher</strong>s<br />
In addition to the concern about the annual <strong>attrition</strong> rate for all teachers, the even higher rate<br />
of <strong>attrition</strong> of beg<strong>in</strong>n<strong>in</strong>g teachers has been particularly troubl<strong>in</strong>g to the field of <strong>education</strong>.<br />
Accord<strong>in</strong>g to TFS data for 2000-01, 8.5% of public school teachers with 1-3 years of full-time<br />
teach<strong>in</strong>g experience left teach<strong>in</strong>g employment annually, whereas 6.5% of teachers with 4-9 years<br />
of experience left annually (Luekens et al., 2004). Based on these data, the estimated rate of<br />
leav<strong>in</strong>g dur<strong>in</strong>g the first three years was 25.5%, dur<strong>in</strong>g the first four years was 32.0%, <strong>and</strong> dur<strong>in</strong>g<br />
the first five years was 38.5%. In addition to TFS, NCES conducted the Baccalaureate <strong>and</strong><br />
Beyond (B&B) Longitud<strong>in</strong>al Study dur<strong>in</strong>g the mid-1990s <strong>and</strong> found annual <strong>attrition</strong> of only<br />
6.9% for public <strong>and</strong> private teachers (comb<strong>in</strong>ed) with 1-3 years of teach<strong>in</strong>g experience (Henke,<br />
Chen, Geis, & Knepper, 2000). This survey was based on a national sample of bachelor’s degree<br />
graduates who entered teach<strong>in</strong>g with<strong>in</strong> a year of graduat<strong>in</strong>g.<br />
Contrasted with these <strong>attrition</strong> statistics, Kozleski et al. (2000) reported that, “Four out of<br />
every ten enter<strong>in</strong>g <strong>special</strong> educators have left before their fifth year” (p. 5)—a four-year rate of<br />
40%. While SETs might have left teach<strong>in</strong>g at a higher rate dur<strong>in</strong>g their first four years than the<br />
32% reported by Luekens et al (2004) for all public teachers, it is not possible to verify the 40%<br />
rate reported by Kozleski et al. for SETs because no data source was cited.<br />
5
<strong>Teacher</strong> Turnover<br />
NCTAF (2003) has also reported questionable <strong>attrition</strong> data for early-career teachers.<br />
Accord<strong>in</strong>g to NCTAF, approximately 46% of all teachers leave dur<strong>in</strong>g the first five years. This<br />
percentage was based on prelim<strong>in</strong>ary data from the 2000-01 TFS (see NCTAF’s Figure 4 note, p.<br />
157). Although NCTAF cited Ingersoll (2002) as the orig<strong>in</strong>al source of the 46% <strong>attrition</strong> rate,<br />
Ingersoll <strong>in</strong>stead reported 39% <strong>attrition</strong> dur<strong>in</strong>g the first five years of teach<strong>in</strong>g experience based<br />
on TFS data, but did not report the TFS year on which the 39% rate was based.<br />
In spite of these ambiguities, NCTAF’s (2003) conclusion that “almost half (of America’s<br />
teachers) may leave dur<strong>in</strong>g the first five years” (p. 24) has been widely repeated, sometimes<br />
without cit<strong>in</strong>g a source (e.g., Center for Education Policy, 2006; Smith & Ingersoll, 2004; The<br />
Teach<strong>in</strong>g Commission, 2006). This conclusion may not be a good estimate because it was based<br />
on prelim<strong>in</strong>ary TFS data for 2000-01. Furthermore, it certa<strong>in</strong>ly does not represent the core of<br />
America’s teach<strong>in</strong>g force—full-time public school teachers. The 46% rate apparently <strong>in</strong>cludes<br />
private school teachers <strong>and</strong> part-time teachers who are known to leave teach<strong>in</strong>g employment at a<br />
substantially higher rate than public school teachers <strong>and</strong> full-time teachers (Luekens et al., 2004).<br />
<strong>Teacher</strong> Turnover Compared with Other Occupations<br />
In addition to research on teacher <strong>turnover</strong> rates, efforts have been made to compare<br />
<strong>turnover</strong> rates <strong>in</strong> teach<strong>in</strong>g <strong>and</strong> other occupations. Current data on employee <strong>turnover</strong> nationally<br />
are published quarterly by the Bureau of National Affairs (BNA) (e.g., BNA, 2002). BNA<br />
def<strong>in</strong>ed <strong>turnover</strong> as leav<strong>in</strong>g the employ<strong>in</strong>g organization (this <strong>in</strong>cludes migrat<strong>in</strong>g to another<br />
organization <strong>in</strong> the same occupation <strong>and</strong> leav<strong>in</strong>g the occupation), exclud<strong>in</strong>g reductions <strong>in</strong> force.<br />
For convenience, we call this “corporate <strong>attrition</strong>” because it is based on leav<strong>in</strong>g an employ<strong>in</strong>g<br />
organization, <strong>and</strong> excludes transfers between sites with<strong>in</strong> the organization. Accord<strong>in</strong>g to BNA,<br />
the corporate <strong>attrition</strong> rate <strong>in</strong> 2000 for all employees was 15.6%.<br />
By comparison, the comb<strong>in</strong>ed rate of public school teacher <strong>attrition</strong> (7.4%) <strong>and</strong> school<br />
migration (7.7%) was 15.1%, based on TFS data for 2000-01. However, almost half of this<br />
school migration percentage (3.6% of the 7.7%) was represented by transfers between schools<br />
with<strong>in</strong> the same district (Luekens et al., 2004). Also, reductions <strong>in</strong> force for public teachers<br />
accounted for about 0.4% of the 6.6% <strong>attrition</strong> rate <strong>in</strong> the 1994-95 TFS (Boe, Bobbitt, Cook,<br />
Barkanic, & Maisl<strong>in</strong>, 1998). Thus, the properly adjusted corporate <strong>attrition</strong> rate for public<br />
teachers <strong>in</strong> 2000-01 was approximately 11.1%; that is, the sum of teacher <strong>attrition</strong> <strong>and</strong> migration,<br />
less school transfers with<strong>in</strong> a district <strong>and</strong> less reductions <strong>in</strong> force. With these adjustments, the<br />
6
<strong>Teacher</strong> Turnover<br />
corporate <strong>attrition</strong> rate of 11.1% for public teachers was well below the BNA rate of 15.6% <strong>in</strong><br />
2000 for employees <strong>in</strong> all occupations—thereby show<strong>in</strong>g that <strong>attrition</strong> from public school<br />
teach<strong>in</strong>g was at least 4% lower than <strong>attrition</strong> from other occupations.<br />
In contrast, NCTAF (2003, Figure 3) reported a corporate <strong>attrition</strong> rate of 11.9% for<br />
employees <strong>in</strong> all “non-teach<strong>in</strong>g” occupations dur<strong>in</strong>g the years 1998-2001, <strong>and</strong> a 15.7% <strong>turnover</strong><br />
rate (movers plus leavers) for all public <strong>and</strong> private school teachers for 2000-01—thereby<br />
<strong>in</strong>dicat<strong>in</strong>g that <strong>turnover</strong> <strong>in</strong> the teach<strong>in</strong>g force was about 4% higher than <strong>in</strong> other occupations. The<br />
11.9% apparently applied to all occupations because BNA does not report corporate <strong>attrition</strong> for<br />
non-teach<strong>in</strong>g occupations per se. Though NCTAF cited Ingersoll (2002) as the source of their<br />
<strong>turnover</strong> rates, Ingersoll actually reported a nationwide average of 11% based on BNA data for<br />
all employees dur<strong>in</strong>g the decade prior to 2002, <strong>and</strong> 17% <strong>turnover</strong> for all teachers based on<br />
prelim<strong>in</strong>ary 2000-01 TFS data. The correct mean corporate <strong>attrition</strong> rate for all employees dur<strong>in</strong>g<br />
the years 1998-2001 was 14.1% (see BNA, 1999, 2000, 2001, 2002)—not the 11.9% reported by<br />
NCTAF. The directly comparable corporate <strong>attrition</strong> rate for all teachers was 13% based <strong>in</strong><br />
Ingersoll’s <strong>turnover</strong> estimate of 17%, as adjusted downward for school transfers with<strong>in</strong> public<br />
school districts <strong>and</strong> for reductions <strong>in</strong> force—not the 15.7% reported by NCTAF. Thus computed,<br />
the corporate <strong>attrition</strong> of all teachers (public <strong>and</strong> private) was less than that of all employees.<br />
Reasons for Leav<strong>in</strong>g Teach<strong>in</strong>g<br />
In conceptualiz<strong>in</strong>g <strong>in</strong>terventions that hold promise for improv<strong>in</strong>g retention, much analysis<br />
has been devoted to the question of why teachers leave teach<strong>in</strong>g (Kozleski et al., 2000; NCTAF,<br />
2003; Bill<strong>in</strong>gsley, 2005). Accord<strong>in</strong>g to national <strong>attrition</strong> data from 1994-95 TFS for public<br />
school teachers, some of the ma<strong>in</strong> reasons for leav<strong>in</strong>g were a variety of personal <strong>and</strong> family<br />
considerations (31%), poor health (5%), <strong>and</strong> school staff<strong>in</strong>g actions (3%). Retirement accounted<br />
for 27%. Only 24% of public teachers wanted to escape from teach<strong>in</strong>g (i.e., to pursue<br />
employment <strong>in</strong> other vocations or because of dissatisfaction with teach<strong>in</strong>g) as their ma<strong>in</strong> reason<br />
for leav<strong>in</strong>g (Whitener, Gruber, Lynch, T<strong>in</strong>gos, Perona, & Fondelier, 1997).<br />
One of the complications <strong>in</strong> underst<strong>and</strong><strong>in</strong>g why teachers leave is the treatment of teacher<br />
retirement. Ingersoll (2002) reported that, “Contrary to conventional wisdom, retirement is not<br />
an e<strong>special</strong>ly prom<strong>in</strong>ent factor. It actually accounts for only a small part (12%) of total <strong>turnover</strong>”<br />
of public <strong>and</strong> private teachers (p. 25). For Ingersoll, the base for comput<strong>in</strong>g the retirement<br />
percentage was “total <strong>turnover</strong>”—that is, the sum of all teachers who leave <strong>and</strong> who migrate to<br />
7
<strong>Teacher</strong> Turnover<br />
different schools. By contrast, the base for comput<strong>in</strong>g the retirement percentage used by Luekens<br />
et al. (2004) was just the number of teachers who leave. Accord<strong>in</strong>g to 2000-01 TFS data, 30% of<br />
public school teachers who actually left teach<strong>in</strong>g collected a pension from a teacher retirement<br />
system (Luekens et al.). Thus, the bases for comput<strong>in</strong>g retirement percentages by Ingersoll <strong>and</strong><br />
Luekens et al. differ <strong>in</strong> two ways—the types of <strong>turnover</strong> <strong>and</strong> the categories of teachers <strong>in</strong>cluded.<br />
The Luekens et al. method is preferred because TFS data show that the <strong>turnover</strong> of public <strong>and</strong><br />
private teachers differs greatly, <strong>in</strong>clud<strong>in</strong>g their reasons for leav<strong>in</strong>g teach<strong>in</strong>g. Therefore,<br />
aggregated data distorts teacher <strong>turnover</strong> statistics for both the public <strong>and</strong> private schools.<br />
Need for Exp<strong>and</strong>ed Analyses of <strong>Teacher</strong> Turnover<br />
This brief review of research on teacher <strong>turnover</strong> has identified a range of issues <strong>in</strong>volv<strong>in</strong>g<br />
rates of <strong>attrition</strong> <strong>and</strong> migration, <strong>turnover</strong> of SETs versus GETs, <strong>attrition</strong> rates of beg<strong>in</strong>n<strong>in</strong>g<br />
teachers, teacher <strong>attrition</strong> rates versus those <strong>in</strong> other occupations, <strong>and</strong> reasons for leav<strong>in</strong>g<br />
teach<strong>in</strong>g. Furthermore, little published research has focused specifically on the <strong>turnover</strong> of SETs<br />
<strong>and</strong> on differences between the <strong>turnover</strong> of SETs <strong>and</strong> GETs, even though the <strong>turnover</strong> of SETs<br />
may be higher or otherwise pose dist<strong>in</strong>ctive problems for develop<strong>in</strong>g a qualified teach<strong>in</strong>g force <strong>in</strong><br />
<strong>special</strong> <strong>education</strong>. McLeskey (2005) reviewed the limited amount of statistics available on the<br />
three types of <strong>turnover</strong> of SETs, <strong>and</strong> concluded that “These statistics reveal an extraord<strong>in</strong>arily<br />
high level of <strong>in</strong>stability <strong>in</strong> the <strong>special</strong> <strong>education</strong> teach<strong>in</strong>g profession, result<strong>in</strong>g <strong>in</strong> teachers mov<strong>in</strong>g<br />
<strong>in</strong> <strong>and</strong> out of <strong>special</strong> <strong>education</strong> classrooms at a disquiet<strong>in</strong>g rate” (p. xvii). In view of <strong>in</strong>adequacies<br />
<strong>in</strong> <strong>turnover</strong> data for SETs, he stated that more recent data <strong>and</strong> more extensive data are needed on<br />
the <strong>turnover</strong> of SETs—e<strong>special</strong>ly on the transfer of SETs to teach<strong>in</strong>g positions <strong>in</strong> <strong>general</strong><br />
<strong>education</strong> (McLeskey, Tyler, & Flipp<strong>in</strong>, 2004).<br />
Accord<strong>in</strong>gly, the ma<strong>in</strong> purpose of this research was to <strong>in</strong>vestigate trends dur<strong>in</strong>g a recent<br />
n<strong>in</strong>e-year period <strong>in</strong> each of the three types of teacher <strong>turnover</strong> (<strong>attrition</strong>, teach<strong>in</strong>g area transfer,<br />
migration), separately for SETs <strong>and</strong> GETs, us<strong>in</strong>g national data produced by the TFSs for 1991-<br />
92, 1994-95, <strong>and</strong> 2000-01. These analyses addressed the ma<strong>in</strong> issues <strong>in</strong> <strong>turnover</strong> reviewed above,<br />
<strong>and</strong> were conducted with TFS data by the same methods so that valid comparisons among them<br />
could be made. All analyses were orig<strong>in</strong>al (<strong>in</strong>stead of replications of prior published research),<br />
<strong>and</strong> extended prior <strong>turnover</strong> research focused on all public school teachers to study<strong>in</strong>g SETs <strong>and</strong><br />
GETs separately. Specifically, we <strong>in</strong>vestigated the follow<strong>in</strong>g central research questions:<br />
8
<strong>Teacher</strong> Turnover<br />
• What trends occurred <strong>in</strong> the separate rates of teacher <strong>attrition</strong>, teach<strong>in</strong>g area transfer, <strong>and</strong><br />
migration dur<strong>in</strong>g a recent n<strong>in</strong>e-year period, <strong>and</strong> to what extent did SETs <strong>and</strong> GETs differ?<br />
• What trend occurred <strong>in</strong> the comb<strong>in</strong>ed rate of teacher <strong>turnover</strong> (unduplicated sum of <strong>attrition</strong>,<br />
teach<strong>in</strong>g area transfer, <strong>and</strong> migration) dur<strong>in</strong>g a recent n<strong>in</strong>e-year period, <strong>and</strong> to what extent<br />
did SETs <strong>and</strong> GETs differ?<br />
• How did rates of teacher <strong>attrition</strong>, teach<strong>in</strong>g area transfer, <strong>and</strong> migration, vary with the<br />
number of years of teach<strong>in</strong>g experience, <strong>and</strong> to what extent did SETs <strong>and</strong> GETs differ?<br />
• How did the rates of <strong>attrition</strong> of SETs <strong>and</strong> GETs compare with the rates of <strong>attrition</strong> <strong>in</strong> other<br />
occupations?<br />
• What were the ma<strong>in</strong> reasons for leav<strong>in</strong>g teach<strong>in</strong>g employment, <strong>and</strong> to what extent did SETs<br />
<strong>and</strong> GETs differ?<br />
Method<br />
Data Sources<br />
Data sources were teachers' self reports to three versions of the Schools <strong>and</strong> Staff<strong>in</strong>g<br />
Surveys (SASS) (1990-91, 1993-94, <strong>and</strong> 1999-00), <strong>and</strong> to their one-year longitud<strong>in</strong>al<br />
components, the TFS (1991-92, 1994-95, <strong>and</strong> 2000-01), conducted by NCES, USDE. Otherwise,<br />
the three SASSs were <strong>in</strong>dependent successive cross-sectional surveys.<br />
The SASS teacher questionnaires provided national <strong>in</strong>formation about public school<br />
teachers (<strong>in</strong>clud<strong>in</strong>g public charter school teachers) dur<strong>in</strong>g the school year prior to <strong>turnover</strong>. The<br />
TFS provided extensive <strong>in</strong>formation about various aspects of the <strong>turnover</strong> of these teachers.<br />
Def<strong>in</strong>itions of Special <strong>and</strong> General Education <strong>Teacher</strong>s from SASS <strong>and</strong> TFS<br />
In keep<strong>in</strong>g with the SASS def<strong>in</strong>ition, a teacher was any <strong>in</strong>dividual who reported either be<strong>in</strong>g<br />
employed full-time or part-time at a public school (<strong>in</strong>clud<strong>in</strong>g public charter schools) with a ma<strong>in</strong><br />
assignment teach<strong>in</strong>g <strong>in</strong> any grade(s) K-12, <strong>in</strong>clud<strong>in</strong>g it<strong>in</strong>erant teachers <strong>and</strong> long-term substitutes.<br />
Excluded from this def<strong>in</strong>ition of a teacher were <strong>in</strong>dividuals who identified their ma<strong>in</strong> assignment as<br />
pre-k<strong>in</strong>dergarten teacher, short-term substitute, student teacher, teacher aide, or a non-teach<strong>in</strong>g<br />
<strong>special</strong>ist of any k<strong>in</strong>d.<br />
The SASS teacher questionnaires asked teachers to designate one of 64 “ma<strong>in</strong> teach<strong>in</strong>g<br />
assignment fields” (MTA) as “the field <strong>in</strong> which you teach the most classes.” We grouped these<br />
64 fields <strong>in</strong>to two ma<strong>in</strong> areas: <strong>special</strong> <strong>education</strong> <strong>and</strong> <strong>general</strong> <strong>education</strong>. Special <strong>education</strong><br />
<strong>in</strong>cluded 15 ma<strong>in</strong> teach<strong>in</strong>g assignment fields such as deaf <strong>and</strong> hard-of-har<strong>in</strong>g, developmentally<br />
9
<strong>Teacher</strong> Turnover<br />
delayed, <strong>and</strong> learn<strong>in</strong>g disabilities. All teachers who designated one of these 15 fields as their<br />
ma<strong>in</strong> teach<strong>in</strong>g assignment were def<strong>in</strong>ed as SETs. Given that these teacher questionnaires<br />
<strong>in</strong>cluded a category for “other <strong>special</strong> <strong>education</strong>,” all elementary <strong>and</strong> secondary teachers with a<br />
ma<strong>in</strong> assignment <strong>in</strong> any area of <strong>special</strong> <strong>education</strong> should have been able to identify themselves as<br />
such, regardless of the particular certification term<strong>in</strong>ology used <strong>in</strong> their home state. GETs were<br />
then def<strong>in</strong>ed as all public school teachers (K-12) other than SETs. <strong>Teacher</strong>s were classified as<br />
SETs or GETs based on their ma<strong>in</strong> teach<strong>in</strong>g assignment (MTA) dur<strong>in</strong>g a SASS year prior to<br />
<strong>turnover</strong>.<br />
<strong>Teacher</strong> Samples<br />
The SASS <strong>and</strong> TFS teacher questionnaires provide nationally representative estimates of the<br />
total numbers of public school teachers (full-time <strong>and</strong> part-time) based on the teacher sample<br />
sizes <strong>and</strong> response rates shown <strong>in</strong> Table A-1 of Appendix A. For completed teacher<br />
questionnaires, NCES imputed values for item nonresponse. More detailed <strong>in</strong>formation about the<br />
three SASS adm<strong>in</strong>istrations is provided by Choy, Henke, Alt, Medrich, <strong>and</strong> Bobbitt (1993,<br />
Appendix C, for the 1990-91 SASS), Henke, Choy, Geis, & Broughman (1996, Appendix C, for<br />
the 1993-94 SASS), <strong>and</strong> Tourk<strong>in</strong> et al. (2004, for the 1999-00 SASS). More detailed <strong>in</strong>formation<br />
about the follow<strong>in</strong>g year TFSs is provided by Bobbitt, Leich, Whitener, <strong>and</strong> Lynch (1994, pp. 19-<br />
44, for the 1991-92 TFS); Whitener, Gruber, Lynch, T<strong>in</strong>gos, Perona, <strong>and</strong> Fondelier (1997, pp. 19-<br />
46, for the 1994-95 TFS); <strong>and</strong> Luekens et al., (2004, Appendix B, for the 2000-01 TFS).<br />
Design<br />
This research was designed to quantify <strong>and</strong> analyze, from a national perspective, three types<br />
of year-to-year <strong>turnover</strong> of public school teachers <strong>in</strong> two broad fields—<strong>special</strong> <strong>education</strong> <strong>in</strong><br />
comparison to <strong>general</strong> <strong>education</strong>. Each type of <strong>turnover</strong> was analyzed <strong>in</strong> terms of trends over the<br />
three adm<strong>in</strong>istrations of SASS/TFS (1990-92, 1993-95, <strong>and</strong> 1999-01). In addition, the<br />
relationship of <strong>turnover</strong> to years of teach<strong>in</strong>g experience was exam<strong>in</strong>ed, as was the dest<strong>in</strong>ation of<br />
teachers <strong>in</strong> the TFS year after <strong>turnover</strong> from the prior SASS year.<br />
Types of <strong>Teacher</strong> Turnover<br />
Three types of teacher <strong>turnover</strong> from three SASS school years (1990-91, 1993-94, <strong>and</strong><br />
1999-00, <strong>in</strong> this research) to the follow<strong>in</strong>g TFS years are def<strong>in</strong>ed below. Each type of <strong>turnover</strong><br />
can be voluntary on the part of a teacher, or based on adm<strong>in</strong>istrative decision (i.e., <strong>in</strong>voluntary on<br />
the part of a teacher). In the aggregate, these three SASS years represent the decade of the 1990s.<br />
10
<strong>Teacher</strong> Turnover<br />
Attrition. The TFSs provided <strong>in</strong>formation about teachers who left teach<strong>in</strong>g employment<br />
follow<strong>in</strong>g each of the three SASS school years (referred to as “leavers”). Those who cont<strong>in</strong>ued<br />
teach<strong>in</strong>g employment are referred to as “cont<strong>in</strong>uers.” Leav<strong>in</strong>g teach<strong>in</strong>g employment is called<br />
<strong>attrition</strong>. It is sometimes referred to as exit <strong>attrition</strong> to dist<strong>in</strong>guished from other forms of <strong>attrition</strong><br />
such as school <strong>attrition</strong> (i.e., leav<strong>in</strong>g teach<strong>in</strong>g <strong>in</strong> a particular school) <strong>and</strong> teach<strong>in</strong>g area <strong>attrition</strong><br />
(e.g., leav<strong>in</strong>g a teach<strong>in</strong>g assignment <strong>in</strong> <strong>special</strong> <strong>education</strong> for some other teach<strong>in</strong>g assignment).<br />
Teach<strong>in</strong>g Area Transfer. For teachers cont<strong>in</strong>u<strong>in</strong>g teach<strong>in</strong>g employment from one school year<br />
to the next, the TFSs provided <strong>in</strong>formation about who transferred from one teach<strong>in</strong>g area to a<br />
different area (such as from <strong>special</strong> <strong>education</strong> to elementary <strong>education</strong>) follow<strong>in</strong>g the three SASS<br />
years (referred to as “switchers”). <strong>Teacher</strong>s who rema<strong>in</strong>ed <strong>in</strong> the same teach<strong>in</strong>g area are referred<br />
to as “rema<strong>in</strong>ers.” Switch<strong>in</strong>g is dist<strong>in</strong>guished from other forms of transfer such as migrat<strong>in</strong>g to a<br />
different school. Teach<strong>in</strong>g area transfer can co-occur with school migration (def<strong>in</strong>ed next).<br />
School Migration. For teachers cont<strong>in</strong>u<strong>in</strong>g teach<strong>in</strong>g employment from one school year to the<br />
next, the TFSs provided <strong>in</strong>formation about who migrated from one public school to a different<br />
school follow<strong>in</strong>g the three SASS years (referred to as “movers”). <strong>Teacher</strong>s who stayed <strong>in</strong> the<br />
same school are referred to as “stayers.”<br />
Teach<strong>in</strong>g Area<br />
Teach<strong>in</strong>g areas were def<strong>in</strong>ed <strong>in</strong> order to compare teach<strong>in</strong>g area transfer for <strong>general</strong> <strong>education</strong><br />
with that for <strong>special</strong> <strong>education</strong>. Of these 64 MTAs listed <strong>in</strong> SASS teacher questionnaires, 15<br />
were <strong>in</strong> <strong>special</strong> <strong>education</strong> with the rema<strong>in</strong><strong>in</strong>g 49 <strong>in</strong> <strong>general</strong> <strong>education</strong>. A “teach<strong>in</strong>g area” was<br />
def<strong>in</strong>ed as a cluster of MTAs that have more <strong>in</strong> common with each other than they do with<br />
MTAs <strong>in</strong> other areas. Accord<strong>in</strong>gly, <strong>special</strong> <strong>education</strong> was def<strong>in</strong>ed as one teach<strong>in</strong>g area, with<br />
<strong>general</strong> <strong>education</strong> represented by 11 teach<strong>in</strong>g areas, as follows:<br />
1. Special <strong>education</strong> (such as developmentally delayed, <strong>and</strong> 14 other <strong>special</strong>izations)<br />
2. English (English, language arts, journalism, <strong>and</strong> read<strong>in</strong>g)<br />
3. Mathematics<br />
4. Science (biology, chemistry, earth science, physics, <strong>and</strong> <strong>general</strong> science)<br />
5. Social science (social studies or social science, <strong>in</strong>clud<strong>in</strong>g history)<br />
6. Arts/music (art, dance, drama/theater, <strong>and</strong> music)<br />
7. Foreign languages (French, German, Lat<strong>in</strong>, Russian, Spanish, <strong>and</strong> other foreign languages)<br />
8. Physical <strong>education</strong> <strong>and</strong> health <strong>education</strong><br />
11
<strong>Teacher</strong> Turnover<br />
9. Bil<strong>in</strong>gual <strong>education</strong> <strong>and</strong> English as a second language<br />
10. Elementary <strong>education</strong> (<strong>in</strong>clud<strong>in</strong>g k<strong>in</strong>dergarten)<br />
11. Vocational/bus<strong>in</strong>ess <strong>education</strong> (account<strong>in</strong>g, agricultural, bus<strong>in</strong>ess, career, health, etc.)<br />
12. Other <strong>general</strong> <strong>education</strong> (home economics, philosophy, architecture, computer science, etc.)<br />
This classification of the 64 MTAs <strong>in</strong>to 12 teach<strong>in</strong>g areas was based on 10 categories NCES<br />
devised for this purpose (Seastrom, Gruber, Henke, McGrath, & Cohen, 2002). We adopted the<br />
10 NCES categories, <strong>and</strong> added two more (vocational <strong>education</strong> <strong>and</strong> other <strong>general</strong> <strong>education</strong>) <strong>in</strong><br />
order to classify all 64 MTAs.<br />
<strong>Teacher</strong>s could out-switch at the end of each SASS school year from any one of these<br />
teach<strong>in</strong>g areas to any one of the other 11 areas dur<strong>in</strong>g the succeed<strong>in</strong>g TFS year. Likewise,<br />
teachers could <strong>in</strong>-switch from a prior school year to any one of these teach<strong>in</strong>g areas from any one<br />
of the other 11 areas. It was also possible, of course, for teachers to switch MTAs with<strong>in</strong> a<br />
teach<strong>in</strong>g area (such as switch<strong>in</strong>g from developmentally delayed to learn<strong>in</strong>g disabilities with<strong>in</strong><br />
<strong>special</strong> <strong>education</strong>). However, with<strong>in</strong>-area switch<strong>in</strong>g was excluded from the def<strong>in</strong>ition of<br />
“teach<strong>in</strong>g area transfer” for the purposes of this research.<br />
Analysis Procedures<br />
Based on the samples of public school teachers complet<strong>in</strong>g the SASS <strong>and</strong> TFS teacher<br />
questionnaires, national estimates of the weighted numbers of teachers of each type <strong>in</strong>cluded <strong>in</strong><br />
the design described above (along with associated percentages <strong>and</strong> st<strong>and</strong>ard errors) were<br />
computed by <strong>special</strong> procedures developed by NCES for complex sample survey data (Tourk<strong>in</strong><br />
et al., 2004). Because SASS data are subject to design effects due to stratification <strong>and</strong> cluster<strong>in</strong>g<br />
of the sample, st<strong>and</strong>ard errors for the national estimates <strong>and</strong> tests of statistical significance were<br />
computed by the method of balanced repeated replications with software entitled WesVar<br />
Version 4.2. Chi-square tests of the statistical significance of differences <strong>in</strong> various <strong>turnover</strong><br />
percentages were performed on the nationally estimated numbers of teachers, with probability<br />
levels based on the sample sizes available for these tests. Logistic regression was used to test the<br />
statistical significance of two predictors (teach<strong>in</strong>g field, TFS year, <strong>and</strong> the field X year<br />
<strong>in</strong>teraction) of each of the three types of teacher <strong>turnover</strong>.<br />
Some of the analyses were performed separately on teacher data from the three<br />
adm<strong>in</strong>istrations of SASS/TFS (1990-92, 1993-95, <strong>and</strong> 1999-01), whereas other analyses were<br />
performed on aggregated teacher data from these three adm<strong>in</strong>istrations. Aggregated teacher data<br />
12
<strong>Teacher</strong> Turnover<br />
were used to <strong>in</strong>crease sample sizes for several topics, thereby permitt<strong>in</strong>g f<strong>in</strong>er gra<strong>in</strong> analyses<br />
(with adequate power) of teacher <strong>turnover</strong> phenomena separately for SETs <strong>and</strong> GETs that would<br />
not have been possible for separate TFS adm<strong>in</strong>istrations.<br />
Computation of Turnover Rates<br />
Annual rates of the nationally-estimated number of public school teachers who left teach<strong>in</strong>g<br />
employment, switched teach<strong>in</strong>g area, or migrated to a different school from one school year to<br />
the next (e.g., from 1999-00 to 2000-01) were each computed as a percentage of the total<br />
nationally-estimated number of public school teachers dur<strong>in</strong>g the base year (e.g., 1999-00). Thus,<br />
the rates of the three types of teacher <strong>turnover</strong> (<strong>attrition</strong>, teach<strong>in</strong>g area transfer, <strong>and</strong> migration)<br />
are directly comparable because they were all computed by the same method.<br />
For comput<strong>in</strong>g mean annual rates for each of the three types of <strong>turnover</strong> dur<strong>in</strong>g a range of<br />
years of teach<strong>in</strong>g experience (e.g., <strong>attrition</strong> dur<strong>in</strong>g the 1-3 years of experience), we adopted the<br />
procedure used by NCES for <strong>attrition</strong> (Luekens et al., 2004) <strong>and</strong> by others (e.g., Ingersoll, 2003).<br />
Specifically, the sum of the number of leavers (e.g., from 1999-00 to 2000-01) with<strong>in</strong> a range of<br />
years of teach<strong>in</strong>g experience (e.g., 1-3) was computed as a percentage of sum of the number of<br />
teachers with<strong>in</strong> the same range of years of teach<strong>in</strong>g experience (e.g., 1-3) dur<strong>in</strong>g the base year<br />
(e.g., 1999-00). This mean annual <strong>attrition</strong> rate for a range of years of teach<strong>in</strong>g experience (e.g.,<br />
1-3) can be multiplied by the number of years <strong>in</strong> the range (e.g., 3) to obta<strong>in</strong> an estimate of the<br />
total annual <strong>attrition</strong> of teachers with that particular range of years of teach<strong>in</strong>g experience.<br />
Limitations<br />
S<strong>in</strong>ce our results are based on large national-probability samples of public school teachers,<br />
they should not be <strong>in</strong>terpreted as directly applicable to the state or local levels unless supported<br />
by other data from the relevant level. For example, <strong>attrition</strong> of SETs might be greater <strong>in</strong> urban<br />
than suburban school districts—another topic for further research. Other than the behavioral<br />
def<strong>in</strong>itions of teacher <strong>attrition</strong> <strong>and</strong> school migration by TFS, SASS <strong>and</strong> TFS data are from<br />
teacher self-reports, <strong>and</strong> therefore subject to errors of recall <strong>and</strong> bias. As with all sample data<br />
such as SASS, the estimates reported are subject to sampl<strong>in</strong>g error as well as to measurement <strong>and</strong><br />
record<strong>in</strong>g error. All estimates should therefore be <strong>in</strong>terpreted as approximate.<br />
13
<strong>Teacher</strong> Turnover<br />
Results: Attrition<br />
Trends <strong>in</strong> Attrition<br />
As seen <strong>in</strong> Figure 1, the annual <strong>attrition</strong> percentages of both public school SETs <strong>and</strong> GETs<br />
<strong>in</strong>creased steadily <strong>and</strong> substantially dur<strong>in</strong>g the 1990s from a level of about 5% to 8%. This trend<br />
was statistically significant (p
<strong>Teacher</strong> Turnover<br />
Attrition by Years of Teach<strong>in</strong>g Experience<br />
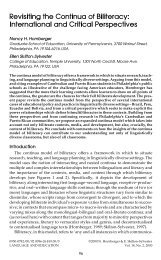
The average annual <strong>attrition</strong> percentages by years of teach<strong>in</strong>g experience are shown <strong>in</strong><br />
Figure 2 for full-time <strong>and</strong> part-time (comb<strong>in</strong>ed) SETs <strong>and</strong> GETs [the differences between<br />
<strong>attrition</strong> percentages for SETs <strong>and</strong> GETs across years of teach<strong>in</strong>g experience was statistically<br />
significant: χ 2 (3, N = 9,927) = 25.04, p < .001]. Just as other research has shown for all teachers<br />
(e.g., Luekens et al., 2004), the highest rate of <strong>attrition</strong> of early-career SETs <strong>and</strong> GETs occurred<br />
EXIT ATTRITION<br />
By Years of Teach<strong>in</strong>g Experience<br />
1 -3 Years<br />
Special Ed<br />
7.9%<br />
General Ed<br />
8.9%<br />
4 - 12 Years<br />
Special Ed<br />
5.1%<br />
General Ed<br />
5.9%<br />
13 - 24 Years<br />
Special Ed<br />
7.9%<br />
General Ed<br />
3.6%<br />
> 24 Years<br />
Special Ed<br />
8.0%<br />
General Ed<br />
10.8%<br />
0% 5% 10% 15%<br />
Annual Attrition Percent<br />
Figure 2. Annual percentage of public<br />
school teachers <strong>in</strong> <strong>special</strong> <strong>and</strong> <strong>general</strong><br />
<strong>education</strong> who left teach<strong>in</strong>g employment,<br />
by years of teach<strong>in</strong>g experience.<br />
Aggregated <strong>attrition</strong> data from the 1991-<br />
92, 1994-95, <strong>and</strong> 2000-01 <strong>Teacher</strong> Follow-<br />
Up Surveys, NCES, USDE.<br />
15
<strong>Teacher</strong> Turnover<br />
dur<strong>in</strong>g the first 3 years of experience (with lower <strong>and</strong> stable rates dur<strong>in</strong>g the follow<strong>in</strong>g 6 years).<br />
The ma<strong>in</strong> differences were that over twice the annual percentage of SETs (than GETs) with 13-<br />
24 years of experience left teach<strong>in</strong>g, whereas more GETs (than SETs) left after 24 years of<br />
experience.<br />
Because the percentage of leavers with 1 - 5 years of teach<strong>in</strong>g experience has been of such<br />
<strong>in</strong>terest <strong>in</strong> the teacher <strong>turnover</strong> <strong>and</strong> retention literature, we also computed this quantity with f<strong>in</strong>al<br />
TFS data for the 2000-01 TFS. For full-time public school teachers <strong>in</strong> 1999-00 with 1-5 years of<br />
total teach<strong>in</strong>g experience (public <strong>and</strong>/or private, full-time <strong>and</strong>/or part-time), the five-year <strong>attrition</strong><br />
percentage was 39.6%; for part-time public school teachers <strong>in</strong> 1999-00, this percentage was<br />
67.4%; for all public school teachers (full- <strong>and</strong> part-time comb<strong>in</strong>ed), this percentage was 42.2%.<br />
<strong>Teacher</strong> Attrition Compared with Other Occupations<br />
To exam<strong>in</strong>e the possibility that teachers leave at a higher rate than <strong>in</strong> other vocations, we<br />
obta<strong>in</strong>ed a type of <strong>turnover</strong> percentage for other vocations from the only available national data<br />
source for calendar years 1991, 1994, <strong>and</strong> 2000 (BNA, 1992, 1995, 2001). Among the various<br />
bus<strong>in</strong>ess <strong>and</strong> non-bus<strong>in</strong>ess occupations for which BNA reported data, we identified the nonbus<strong>in</strong>ess<br />
category (<strong>and</strong> its subset, health care) as most comparable to the national teach<strong>in</strong>g force.<br />
BNA reported <strong>turnover</strong> at the corporate level, viz. the percentage of employees of particular<br />
corporations who leave their corporate employers annually (exclud<strong>in</strong>g departures due to<br />
reductions <strong>in</strong> force). For public school teachers, this is equivalent to <strong>attrition</strong> plus the migration<br />
of teachers from a local <strong>education</strong> agency (LEA) (i.e., the employ<strong>in</strong>g entity) to schools <strong>in</strong> a<br />
different LEA or to private schools. We termed this specific type of <strong>turnover</strong> “corporate<br />
<strong>attrition</strong>.” For public school teachers, corporate <strong>attrition</strong> therefore excludes the migration of<br />
teachers among schools with<strong>in</strong> an LEA.<br />
As seen <strong>in</strong> Figure 3, the annual corporate <strong>attrition</strong> percentage of SETs <strong>and</strong> GETs dur<strong>in</strong>g the<br />
1990s (aggregated) was comparable (about 10%), but clearly less than that from all non-bus<strong>in</strong>ess<br />
occupations (about 13%). The average corporate <strong>attrition</strong> for all employers surveyed by BNA<br />
dur<strong>in</strong>g this time was 12%. In mak<strong>in</strong>g this comparison, it is important to recognize that BNA<br />
corporate <strong>attrition</strong> data for non-bus<strong>in</strong>ess occupations excluded <strong>attrition</strong> due to reductions <strong>in</strong> force<br />
whereas the teacher <strong>attrition</strong> data <strong>in</strong>cludes reductions <strong>in</strong> force approximat<strong>in</strong>g 0.3% annually.<br />
Thus, there is no evidence that public school teachers left their LEA of employment at a higher<br />
16
<strong>Teacher</strong> Turnover<br />
Corporate Attrition<br />
NonBus<strong>in</strong>ess<br />
Health Care<br />
13.2%<br />
17.2%<br />
Special Ed<br />
General Ed<br />
10.1%<br />
9.7%<br />
0% 5% 10% 15% 20% 25%<br />
Annual Corporate Attrition Percent<br />
Figure 3. Annual corporate <strong>attrition</strong><br />
percent for public school teachers <strong>in</strong><br />
<strong>special</strong> <strong>and</strong> <strong>general</strong> <strong>education</strong> <strong>in</strong><br />
comparison with other occupation fields.<br />
Corporate <strong>attrition</strong> is def<strong>in</strong>ed by leav<strong>in</strong>g<br />
an employer, such as a corporation or<br />
school district. Percents shown represent<br />
the mean <strong>attrition</strong> <strong>in</strong> 1991, 1994, <strong>and</strong><br />
2000. <strong>Teacher</strong> data from <strong>Teacher</strong> Follow-<br />
Up Surveys, NCES, USDE. Other<br />
occupation data from the Employer<br />
Surveys by the Bureau of National Affairs<br />
(BNA), Inc.<br />
rate than did employees from non-bus<strong>in</strong>ess employers nationally. In fact, the corporate <strong>attrition</strong><br />
rate of public teachers was actually lower than for non-bus<strong>in</strong>ess occupations dur<strong>in</strong>g the 1990s.<br />
Reasons for Leav<strong>in</strong>g Teach<strong>in</strong>g<br />
As shown <strong>in</strong> Table 1, there is a variety of ma<strong>in</strong> reasons given by public school teachers for<br />
leav<strong>in</strong>g teach<strong>in</strong>g. To secure sufficient sample size for detailed analyses of this phenomenon, we<br />
aggregated <strong>attrition</strong> data across three TFSs dur<strong>in</strong>g the 1990s. Even so, the samples for some of<br />
the particular reasons for leav<strong>in</strong>g by SETs were small (i.e., less than 30). Therefore, only the<br />
subtotals for the five categories of reasons shown <strong>in</strong> Table 1 were considered.<br />
17
<strong>Teacher</strong> Turnover<br />
Table 1. Ma<strong>in</strong> Reasons for Leav<strong>in</strong>g Given by Exit<strong>in</strong>g Public School <strong>Teacher</strong>s Nationally by<br />
Teach<strong>in</strong>g Field for Three School Years Comb<strong>in</strong>ed (1991-92, 1994-95, <strong>and</strong> 2000-01)<br />
Nationally Estimated Leavers Per Year<br />
Special Education<br />
General Education<br />
Ma<strong>in</strong> Reason for Leav<strong>in</strong>g Number Col % Number Col %<br />
I. Escape Teach<strong>in</strong>g<br />
A. Other Career 2,698 14.5 % 14,164 9.3 %<br />
B. Better Salary 1,737 9.4 % 10,434 6.9 %<br />
C. Take Courses for Other Career 226 b 1.2 % 1,907 1.3 %<br />
D. Dissatisfaction with Teach<strong>in</strong>g 2,151 b 11.6 % 9,645 6.3 %<br />
Subtotal a 6,812 36.7 % 36,150 23.8 %<br />
II.<br />
Professional Development<br />
A. Take Courses for Education Career 982 5.3 % 8,553 5.6 %<br />
B. Sabbatical 438 2.4 % 4,891 3.2 %<br />
Subtotal a 1,420 7.7 % 13,444 8.8 %<br />
III. Personal<br />
A. Family or Personal 2,589 14.0 % 25,630 16.9 %<br />
B. Pregnancy/Child Bear<strong>in</strong>g 3,311 17.8 % 18,597 12.2 %<br />
Subtotal a 5,900 31.8 % 44,227 29.1 %<br />
IV. Involuntary<br />
A. Health 314 b 1.7 % 7,911 5.2 %<br />
B. Staff<strong>in</strong>g Action 1,034 b 5.6 % 6,513 4.3 %<br />
Subtotal a 1,348 7.3 % 14,424 9.5 %<br />
V. Retirement a 3,060 16.5 % 43,727 28.8 %<br />
Total Leavers:<br />
Nationally Estimated Leavers per Year 18,540 100.0 % 151,972 100.0%<br />
As % of Total <strong>Teacher</strong>s 6.3 % 6.4 %<br />
Note. Aggregated data from the 1991-92, 1994-95, <strong>and</strong> 2000-01 <strong>Teacher</strong> Follow-Up Surveys, NCES, USDE.<br />
a The subtotals for ma<strong>in</strong> reasons for leav<strong>in</strong>g by teach<strong>in</strong>g field (5 x 2) χ 2 was 8.6 (p > 0.05).<br />
b Sample size (n) less than 30<br />
18
<strong>Teacher</strong> Turnover<br />
There has been particular concern <strong>in</strong> the teach<strong>in</strong>g profession that a high percentage of<br />
teachers leave because they seek better career opportunities elsewhere or are simply dissatisfied<br />
with teach<strong>in</strong>g. We refer to this set of reasons for leav<strong>in</strong>g as “escape teach<strong>in</strong>g,” <strong>and</strong> dist<strong>in</strong>guish<br />
them from leav<strong>in</strong>g for personal reasons, professional development <strong>in</strong> <strong>education</strong>, <strong>and</strong> retirement.<br />
Escapees, <strong>in</strong> particular, have some reason for want<strong>in</strong>g out of teach<strong>in</strong>g. However, as seen <strong>in</strong> Table<br />
1, only a m<strong>in</strong>ority of teachers leave to escape (about one-third of SET leavers <strong>and</strong> one-fourth of<br />
GET leavers, a difference that is not statistically significant).<br />
Overall, SETs <strong>and</strong> GETs do not differ at a statistically significant level <strong>in</strong> their reasons for<br />
leav<strong>in</strong>g teach<strong>in</strong>g. In particular, however, a lower percentage of SETs than GETs left to retire<br />
(16.5% vs. 28.8%, respectively) [a statistically significant difference: χ 2 (1, N = 5,035) = 5.84, p<br />
<strong>Teacher</strong> Turnover<br />
our analyses of these aggregated SASS/TFS data dur<strong>in</strong>g the 1990s demonstrated only a m<strong>in</strong>ority<br />
of reenter<strong>in</strong>g teachers (23% <strong>in</strong> <strong>special</strong> <strong>education</strong>; 15% <strong>in</strong> <strong>general</strong> <strong>education</strong>) were employed <strong>in</strong><br />
non-teach<strong>in</strong>g positions <strong>in</strong> <strong>education</strong> (K-12 grades) dur<strong>in</strong>g the year prior to reentry. Based on<br />
annually averages for SETs <strong>and</strong> GETs comb<strong>in</strong>ed, about 58,000 leavers took non-teach<strong>in</strong>g<br />
positions <strong>in</strong> <strong>education</strong>. However, only 11,000 reenter<strong>in</strong>g experienced teachers were employed <strong>in</strong><br />
such positions dur<strong>in</strong>g the year prior to reentry. Thus, there has not been massive recycl<strong>in</strong>g<br />
between teach<strong>in</strong>g <strong>and</strong> non-teach<strong>in</strong>g positions <strong>in</strong> K-12 <strong>education</strong>.<br />
Results: Teach<strong>in</strong>g Area Transfer<br />
Trends <strong>in</strong> Teach<strong>in</strong>g Area Transfer<br />
As seen <strong>in</strong> Figure 4, the annual teach<strong>in</strong>g area transfer percentages of both public school<br />
SETs <strong>and</strong> GETs (to one of 11 other teach<strong>in</strong>g areas) <strong>in</strong>creased steadily <strong>and</strong> substantially<br />
(<strong>in</strong>creases of about 4 percentage po<strong>in</strong>ts from 1991-00 to 2000-01) dur<strong>in</strong>g the 1990s. This trend<br />
was statistically significant (p
<strong>Teacher</strong> Turnover<br />
variables <strong>in</strong> the model were TFS year (1991-02, 1994-95, <strong>and</strong> 2000-01), teach<strong>in</strong>g field (<strong>special</strong><br />
vs. <strong>general</strong> <strong>education</strong>), <strong>and</strong> year by field <strong>in</strong>teraction term.<br />
This evidence <strong>in</strong>dicates that teach<strong>in</strong>g area switch<strong>in</strong>g from <strong>special</strong> <strong>education</strong> was equivalent<br />
<strong>in</strong> magnitude to that of <strong>general</strong> <strong>education</strong> dur<strong>in</strong>g the 1990s. In compar<strong>in</strong>g the teach<strong>in</strong>g area<br />
switch<strong>in</strong>g rates (Figure 4) with the <strong>attrition</strong> percentages (Figure 1), it is clear that teach<strong>in</strong>g area<br />
transfer rates were consistently higher than <strong>attrition</strong> rates for both SETs <strong>and</strong> GETs. Both k<strong>in</strong>ds of<br />
<strong>turnover</strong> represent losses of teachers to a teach<strong>in</strong>g area. Follow<strong>in</strong>g the 1999-00 school year, for<br />
example, almost one-fifth of teachers (19%) were lost to <strong>special</strong> <strong>education</strong> either through<br />
switch<strong>in</strong>g to some other teach<strong>in</strong>g area or through leav<strong>in</strong>g teach<strong>in</strong>g employment. S<strong>in</strong>ce similar<br />
percentage losses of teachers were found for most teach<strong>in</strong>g areas of <strong>general</strong> <strong>education</strong>, large<br />
annual <strong>turnover</strong> of teachers at the teach<strong>in</strong>g area level is characteristic of the teach<strong>in</strong>g<br />
profession—not particular to <strong>special</strong> <strong>education</strong>.<br />
Teach<strong>in</strong>g Area Transfer by Years of Teach<strong>in</strong>g Experience<br />
As with <strong>attrition</strong> (see Figure 2), teach<strong>in</strong>g area transfer might be higher for public school<br />
teachers dur<strong>in</strong>g their early career years. The average annual switch<strong>in</strong>g percentages by years of<br />
teach<strong>in</strong>g experience are shown <strong>in</strong> Figure 5 for full-time <strong>and</strong> part-time (comb<strong>in</strong>ed) SETs <strong>and</strong><br />
GETs [the differences between switch<strong>in</strong>g percentages for SETs <strong>and</strong> GETs across blocks was<br />
statistically significant: χ 2 (2, N = 9,927) = 10.45, p < .01]. The highest rate of teach<strong>in</strong>g area<br />
transfer of SETs occurred dur<strong>in</strong>g their first 3 years of experience, with gradually <strong>and</strong><br />
substantially decl<strong>in</strong><strong>in</strong>g rates with <strong>in</strong>creas<strong>in</strong>g years of experience. The teach<strong>in</strong>g area transfer rate<br />
of GETs was equivalent to that of SETs dur<strong>in</strong>g the first 3 years of experience, but (<strong>in</strong> contrast<br />
with SETs) rema<strong>in</strong>ed at the same level dur<strong>in</strong>g years 4-12 of experience <strong>and</strong> decl<strong>in</strong>ed little<br />
beyond 12 years of experience. Thus, the higher overall rate of teach<strong>in</strong>g area transfer of GETs<br />
(than SETs) seen <strong>in</strong> Figure 4 can be attributed to that of teachers with more than 3 years of<br />
experience.<br />
Special Education: <strong>Teacher</strong> Out-Switch<strong>in</strong>g <strong>and</strong> In-Switch<strong>in</strong>g<br />
As reported above, about half of the <strong>attrition</strong> of SETs was offset by the reentry of<br />
experienced former teachers. A much larger offset occurs with respect to out-switch<strong>in</strong>g of<br />
teachers from <strong>special</strong> <strong>education</strong>. As seen <strong>in</strong> Figure 6, the out-switch<strong>in</strong>g of SETs to <strong>general</strong><br />
<strong>education</strong> is equivalent to the simultaneous <strong>in</strong>-switch<strong>in</strong>g of GETs to <strong>special</strong> <strong>education</strong>. Although<br />
there was an overall trend dur<strong>in</strong>g the 1990s of an <strong>in</strong>creas<strong>in</strong>g number of teachers switch<strong>in</strong>g out of,<br />
21
<strong>Teacher</strong> Turnover<br />
TEACHING AREA TRANSFER<br />
By Years of Teach<strong>in</strong>g Experience<br />
1 -3 Years<br />
Special Ed<br />
General Ed<br />
12.0%<br />
11.6%<br />
4 - 12 Years<br />
Special Ed<br />
9.1%<br />
General Ed<br />
11.8%<br />
> 12 Years<br />
Special Ed<br />
6.4%<br />
General Ed<br />
10.3%<br />
0% 5% 10% 15%<br />
Annual Area Transfer Percent<br />
Figure 5. Annual percentage of public<br />
school teachers <strong>in</strong> <strong>special</strong> <strong>and</strong> <strong>general</strong><br />
<strong>education</strong> who transferred to one of<br />
eleven teach<strong>in</strong>g areas, by years of<br />
teach<strong>in</strong>g experience. Aggregated<br />
transfer data from the 1991-92, 1994-<br />
95, <strong>and</strong> 2000-01 <strong>Teacher</strong> Follow-Up<br />
Surveys, NCES, USDE.<br />
<strong>and</strong> <strong>in</strong>to, <strong>special</strong> <strong>education</strong>, the apparent stronger <strong>in</strong>crease of <strong>in</strong>-switch<strong>in</strong>g than out-switch<strong>in</strong>g was<br />
not statistically significant. Overall, the out-switchers from <strong>special</strong> <strong>education</strong> (73,000 dur<strong>in</strong>g the<br />
three years observed) were offset by equivalent numbers of <strong>in</strong>-switchers from <strong>general</strong> <strong>education</strong><br />
(75,000).<br />
Additional analyses demonstrated that 46% of SET out-switchers went to elementary<br />
<strong>education</strong>, while 28% of <strong>in</strong>-switchers from <strong>general</strong> to <strong>special</strong> <strong>education</strong> came from elementary<br />
<strong>education</strong> <strong>and</strong> another 28% came from the language areas (language arts, read<strong>in</strong>g, English, <strong>and</strong><br />
journalism). The rema<strong>in</strong><strong>in</strong>g out- <strong>and</strong> <strong>in</strong>-switchers were scattered over other teach<strong>in</strong>g areas.<br />
22
<strong>Teacher</strong> Turnover<br />
TEACHING FIELD TRANSFER<br />
Special Education Out- <strong>and</strong> In-Switch<strong>in</strong>g<br />
1991<br />
Out-Switch to Gen Ed<br />
In-Switch from Gen Ed<br />
11 K<br />
16 K<br />
1994<br />
Out-Switch to Gen Ed<br />
In-Switch from Gen Ed<br />
24 K<br />
23 K<br />
2000<br />
Out-Switch to Gen Ed<br />
33 K<br />
In-Switch from Gen Ed<br />
40 K<br />
0 20 40 60<br />
Number of Switchers (1000s)<br />
Figure 6. Number (1000s) of <strong>special</strong><br />
<strong>education</strong> teachers who transferred to<br />
<strong>general</strong> <strong>education</strong> (out-switch<strong>in</strong>g), <strong>and</strong><br />
number of <strong>general</strong> <strong>education</strong> teachers<br />
who transfer <strong>in</strong>to <strong>special</strong> <strong>education</strong> (<strong>in</strong>switch<strong>in</strong>g),<br />
by school year. Aggregated<br />
transfer data from the 1991-92, 1994-95,<br />
<strong>and</strong> 2000-01 <strong>Teacher</strong> Follow-Up<br />
Surveys, NCES, USDE.<br />
Results: School Migration<br />
Trends <strong>in</strong> School Migration<br />
As seen <strong>in</strong> Figure 7, the annual school migration percentages of public school SETs was<br />
higher overall dur<strong>in</strong>g the 1990s than the migration percentages of GETs. This difference was<br />
statistically significant (p
<strong>Teacher</strong> Turnover<br />
Annual School Migration Percent<br />
14%<br />
12%<br />
10%<br />
8%<br />
6%<br />
4%<br />
2%<br />
0%<br />
10.4%<br />
School Migration<br />
7.3%<br />
Special Education<br />
10.2%<br />
6.9% 7.1%<br />
7.4%<br />
General Education<br />
91-92 94-95 00-01<br />
School Year<br />
Figure 7. Annual percentage of public school<br />
teachers <strong>in</strong> <strong>special</strong> <strong>and</strong> <strong>general</strong> <strong>education</strong><br />
who migrated to a different school, by<br />
school year. Data from the 1991-92, 1994-<br />
95, <strong>and</strong> 2000-01 <strong>Teacher</strong> Follow-Up<br />
Surveys, NCES, USDE.<br />
(1991-92, 1994-95, <strong>and</strong> 2000-01), teach<strong>in</strong>g field (<strong>special</strong> vs. <strong>general</strong> <strong>education</strong>), <strong>and</strong> year by field<br />
<strong>in</strong>teraction term.<br />
These results <strong>in</strong>dicate that the school migration of SETs was higher than that of GETs<br />
dur<strong>in</strong>g the 1990s, <strong>and</strong> higher than both <strong>attrition</strong> <strong>and</strong> teach<strong>in</strong>g area transfer. Dur<strong>in</strong>g the three years<br />
dur<strong>in</strong>g the 1990s for which TFS <strong>turnover</strong> data are available, the aggregate <strong>turnover</strong> percentages<br />
for SETs were as follows: 6.7% for leav<strong>in</strong>g, 8.3% for switch<strong>in</strong>g, <strong>and</strong> 9.4% for mov<strong>in</strong>g. S<strong>in</strong>ce<br />
some teachers were both switchers <strong>and</strong> movers, summ<strong>in</strong>g these percentages would yield an<br />
overestimate of total <strong>turnover</strong>.<br />
School Migration by Years of Teach<strong>in</strong>g Experience<br />
As with <strong>attrition</strong> <strong>and</strong> teach<strong>in</strong>g area transfer, school migration might be higher for public<br />
school teachers dur<strong>in</strong>g their early career years (see Figures 2 <strong>and</strong> 5). The average annual<br />
migration percentages by years of teach<strong>in</strong>g experience are shown <strong>in</strong> Figure 8 for full-time <strong>and</strong><br />
part-time (comb<strong>in</strong>ed) SETs <strong>and</strong> GETs [the differences between school migration percentages for<br />
SETs <strong>and</strong> GETs across blocks was statistically significant: χ 2 (2, N = 14,344) = 60.31, p < .001].<br />
The highest rate of school migration of both SETs <strong>and</strong> GETs occurred dur<strong>in</strong>g their first three<br />
24
<strong>Teacher</strong> Turnover<br />
SCHOOL MIGRATION<br />
By Years of Teach<strong>in</strong>g Experience<br />
1 -3 Years<br />
Special Ed<br />
General Ed<br />
19.8%<br />
13.1%<br />
4 - 12 Years<br />
Special Ed<br />
General Ed<br />
8.5%<br />
9.9%<br />
> 12 Years<br />
Special Ed<br />
General Ed<br />
7.2%<br />
4.2%<br />
0% 10% 20% 30%<br />
Annual School Migration Percent<br />
Figure 8. Annual percentage of public<br />
school teachers <strong>in</strong> <strong>special</strong> <strong>and</strong> <strong>general</strong><br />
<strong>education</strong> who migrated to a different<br />
school, by years of teach<strong>in</strong>g experience.<br />
Aggregated migration data from the<br />
1991-92, 1994-95, <strong>and</strong> 2000-01<br />
<strong>Teacher</strong> Follow-Up Surveys, NCES,<br />
USDE.<br />
years of teach<strong>in</strong>g, with gradually <strong>and</strong> substantially decl<strong>in</strong><strong>in</strong>g rates thereafter. The school<br />
migration rate of SETs dur<strong>in</strong>g the first three years was substantially higher than that of GETs<br />
(19.3% vs. 13.1%, respectively) [a statistically significant difference: χ 2 (1, N = 3,711) = 9.33, p<br />
< .01]. Thus, much of the overall higher rate of school migration of SETs (than GETs) seen <strong>in</strong><br />
Figure 7 can be attributed to that of teachers with 1 to 3 years of experience.<br />
25
<strong>Teacher</strong> Turnover<br />
Dest<strong>in</strong>ation of School Migrants<br />
Based on aggregated school migration data for the 1990s, 9.4% of public school SETs <strong>and</strong><br />
7.1% of GETs migrated from one school to another annually. Of those who moved, well over<br />
half migrated to schools with<strong>in</strong> the same LEA (62.3% of SETs; 52.5% of GETs, from Table 2).<br />
Slightly over half of with<strong>in</strong>-LEA migration was <strong>in</strong>voluntary on the part of teachers; it was<br />
reassignment by adm<strong>in</strong>istrative decision (Boe, Barkanic, & Leow, 1999).<br />
Most other movers went to other LEAs <strong>in</strong> the same state (29.8% of SETs; 34.7% of GETs),<br />
while the rema<strong>in</strong><strong>in</strong>g small percentage of movers went out of state or to private schools.<br />
Results: Attrition, Transfer, <strong>and</strong> Migration Comb<strong>in</strong>ed<br />
As seen <strong>in</strong> Figure 9, the total annual <strong>turnover</strong> (the sum of <strong>attrition</strong>, teach<strong>in</strong>g area transfer,<br />
<strong>and</strong> school migration) of SETs <strong>and</strong> GETs <strong>in</strong>creased substantially dur<strong>in</strong>g the n<strong>in</strong>e-year period<br />
from 1991-92 to 2000-01. Turnover <strong>in</strong>creased 60% for all public teachers (from 478,000 to<br />
767,000 annually). These total <strong>turnover</strong> numbers are unduplicated counts. That is, teachers who<br />
both switched teach<strong>in</strong>g area <strong>and</strong> moved to a different school are counted only once.<br />
Some of this <strong>in</strong>crease <strong>in</strong> the numbers of teachers turn<strong>in</strong>g over might be expected because the<br />
teach<strong>in</strong>g force grew dur<strong>in</strong>g these years. However, the rate of total <strong>turnover</strong> for all public teachers<br />
likewise <strong>in</strong>creased substantially (from 18.8% <strong>in</strong> 1991-92 to 25.62% <strong>in</strong> 2000-01, a 36% <strong>in</strong>crease).<br />
Moreover, the number of teachers turn<strong>in</strong>g over per public school <strong>in</strong>creased from 5.66 <strong>in</strong> 1991-92<br />
to 8.34 <strong>in</strong> 2000-01 (a 47% <strong>in</strong>crease).<br />
Based on aggregated data for 1991-92, 1994-95, <strong>and</strong> 2000-01, the total annual <strong>turnover</strong> of<br />
public school teachers was virtually identical for SETs <strong>and</strong> GETs (22.8% <strong>and</strong> 22.4%,<br />
respectively). The magnitude of <strong>in</strong>dependent components of teacher <strong>turnover</strong> is shown <strong>in</strong> Table<br />
3. S<strong>in</strong>ce <strong>attrition</strong> only accounted for about 30% of total <strong>turnover</strong>, the substantial majority of<br />
<strong>turnover</strong> lies with<strong>in</strong> the ranks of employed teachers. While this poses problems for staff<strong>in</strong>g<br />
schools <strong>and</strong> teach<strong>in</strong>g areas from which teachers depart, it contributes to solv<strong>in</strong>g staff<strong>in</strong>g<br />
problems for schools <strong>and</strong> teach<strong>in</strong>g areas that such teachers enter. At least <strong>turnover</strong> with<strong>in</strong> the<br />
national teach<strong>in</strong>g force does not require replacement teachers to be recruited from outside the<br />
force.<br />
As seen <strong>in</strong> Table 3, there were some differences between SETs <strong>and</strong> GETs <strong>in</strong> the extent of<br />
various types of <strong>turnover</strong>. SETs were somewhat less likely to switch teach<strong>in</strong>g areas than GETs,<br />
while SETs were somewhat more likely to move to a different school than GETs. Consider<strong>in</strong>g<br />
26
<strong>Teacher</strong> Turnover<br />
Table 2. School Dest<strong>in</strong>ations of Migrat<strong>in</strong>g Public School <strong>Teacher</strong>s Nationally by Teach<strong>in</strong>g Field<br />
for Three School Years Comb<strong>in</strong>ed (1991-92, 1994-05, 2000-01)<br />
Teach<strong>in</strong>g Field a<br />
Dest<strong>in</strong>ation of Movers Statistic b Special Education General Education<br />
Different School Column % 62.3% 52.5%<br />
Same District (Std Error %) (3.9%) (1.9%)<br />
National Est/Year 17,253 89,617<br />
Different District Column % 29.8% 34.7%<br />
Same State (Std Error %) (3.3%) (1.8%)<br />
National Est/Year 8,239 59,126<br />
Out of State District Column % 4.2% 9.0%<br />
(Std Error %) (0.9%) (1.2%)<br />
National Est/Year 1,149 15,382<br />
Private School Column % 3.7% c 3.8%<br />
(St<strong>and</strong>ard Error %) (3.0%) (0.7%)<br />
National Est/Year 1,037 6,502<br />
Mover Total National Est/Year 27,678 170,627<br />
Column % 100.0% 100.0%<br />
Note. Aggregated data from the 1991-92, 1994-95, <strong>and</strong> 2000-01 <strong>Teacher</strong> Follow-Up Surveys, NCES, USDE.<br />
a The dest<strong>in</strong>ation of movers by teach<strong>in</strong>g field (4 x 2) χ 2 was 4.40 (p > 0.05).<br />
b<br />
Nationally weighted estimates per year (Est/Year) of the total numbers of full-time <strong>and</strong> part-time teachers<br />
comb<strong>in</strong>ed at both the elementary <strong>and</strong> secondary levels <strong>in</strong> the public sector.<br />
c Sample size (n) less than 30.<br />
27
<strong>Teacher</strong> Turnover<br />
the extent of differences <strong>in</strong> all components of <strong>turnover</strong>, however, <strong>special</strong> <strong>education</strong> <strong>and</strong> <strong>general</strong><br />
<strong>education</strong> were more similar than different.<br />
Nonetheless, almost 1 of every 4 specific teach<strong>in</strong>g positions <strong>in</strong> both <strong>special</strong> <strong>and</strong> <strong>general</strong><br />
<strong>education</strong> was subject to annual <strong>turnover</strong> dur<strong>in</strong>g the 1990s. That is, as positions became open<br />
through the departure of <strong>in</strong>cumbent teachers, they were filled with different teachers (assum<strong>in</strong>g<br />
these open positions were not left vacant or discont<strong>in</strong>ued—rare events accord<strong>in</strong>g to Henke,<br />
Choy, Chen, Geis, Alt, <strong>and</strong> Broughman (1997). This degree of <strong>in</strong>stability <strong>in</strong> the teach<strong>in</strong>g staff of<br />
<strong>in</strong>dividual schools represents a serious problem that <strong>education</strong>al adm<strong>in</strong>istrators must, <strong>and</strong> do,<br />
solve each year.<br />
TOTAL TEACHER TURNOVER<br />
By Teach<strong>in</strong>g Field <strong>and</strong> Year<br />
Special Education<br />
1991 - 92<br />
2000 - 01<br />
54<br />
90<br />
General Education<br />
1991 - 92<br />
424<br />
2000 - 01<br />
677<br />
All Public Education<br />
1991 - 92<br />
478<br />
2000 - 01<br />
767<br />
0 200 400 600 800<br />
<strong>Teacher</strong> Turnover (1000s)<br />
Figure 9.Annual total <strong>turnover</strong> of public<br />
school teachers <strong>in</strong> <strong>special</strong> <strong>and</strong> <strong>general</strong><br />
<strong>education</strong> (<strong>attrition</strong>, teach<strong>in</strong>g area<br />
transfer, <strong>and</strong> school migration, comb<strong>in</strong>ed)<br />
based on unduplicated counts of 1000s of<br />
teachers. Data from the 1991-92 <strong>and</strong><br />
2000-01 <strong>Teacher</strong> Follow-Up Surveys,<br />
NCES, USDE.<br />
28
<strong>Teacher</strong> Turnover<br />
Table 3. Turnover Components for Public School <strong>Teacher</strong>s Nationally by Teach<strong>in</strong>g Field for<br />
Three School Years Comb<strong>in</strong>ed (1991-92, 1994-05, 2000-01)<br />
Teach<strong>in</strong>g Field a<br />
Turnover Components Statistic b Special<br />
Education<br />
General<br />
Education<br />
A. Attrition Column % 29.5% 28.4%<br />
(Std Error %) (3.0%) (0.8%)<br />
National Est/Year 19,922 153,009<br />
B. Teach<strong>in</strong>g Area Transfer<br />
1.Stay Same School Column % 29.6% 39.8%<br />
(Std Error %) (3.2%) (1.1%)<br />
National Est/Year 19,979 214,239<br />
2.Move Different School Column % 6.6% c 9.0%<br />
(Std Error %) (1.1%) (0.7%)<br />
National Est/Year 4,470 48,277<br />
Subtotal Column % 36.2% 48.8%<br />
(Std Error %) (3.2%) (1.2%)<br />
National Est/Year 24,449 262,516<br />
C. Move Different School,<br />
Rema<strong>in</strong> Same Teach<strong>in</strong>g Area Column % 34.3% 22.8%<br />
(Std Error %) (2.3%) (0.9%)<br />
National Est/Year 23,209 122,495<br />
Total Turnover National Est/Year 67,580 538,020<br />
Column % 100.0% 100.0%<br />
Note. Aggregated data from the 1991-92, 1994-95, <strong>and</strong> 2000-01 <strong>Teacher</strong> Follow-Up Surveys, NCES, USDE.<br />
a<br />
The five <strong>turnover</strong> components by teach<strong>in</strong>g field (4 x 2) χ 2 was 25.28 (p < 0.001).<br />
b<br />
Nationally weighted estimates per (Est/Year) of the total numbers of full-time <strong>and</strong> part-time teachers comb<strong>in</strong>ed<br />
at both the elementary <strong>and</strong> secondary levels <strong>in</strong> the public sector.<br />
c<br />
Sample size (n) less than 30.<br />
29
<strong>Teacher</strong> Turnover<br />
Discussion<br />
Clearly, teacher <strong>turnover</strong> has been high nationally: 22-23% of public SETs <strong>and</strong> GETs either<br />
left teach<strong>in</strong>g, switched teach<strong>in</strong>g area, or migrated to a different school annually dur<strong>in</strong>g the 1990s.<br />
This level of <strong>turnover</strong> is even higher than reported elsewhere (e.g., Ingersoll, 2003) because we<br />
<strong>in</strong>cluded teach<strong>in</strong>g area transfer as part of <strong>turnover</strong> as well as <strong>attrition</strong> <strong>and</strong> migration. Not only is<br />
the rate of overall teacher <strong>turnover</strong> high, but it actually <strong>in</strong>creased by over a third dur<strong>in</strong>g the n<strong>in</strong>e<br />
years from 1991-92 to 2000-01 due to growth <strong>in</strong> the rates of <strong>attrition</strong> <strong>and</strong> teach<strong>in</strong>g area transfer.<br />
The field of <strong>education</strong> has allowed this to happen even though it has been recognized that teacher<br />
<strong>turnover</strong> is costly <strong>in</strong> terms of student achievement, school function<strong>in</strong>g, <strong>and</strong> f<strong>in</strong>ancial expenditures<br />
(see review by Johnson et al., 2005). Of course, the impact of teacher <strong>turnover</strong> must be, has been,<br />
<strong>and</strong> no doubt will be managed every year by our public school systems. Its costs will cont<strong>in</strong>ue to<br />
be paid, however, unless better ways to reduce these costs are devised <strong>and</strong> implemented to scale.<br />
We recognize that some <strong>in</strong>itiatives to reduce the high <strong>and</strong> <strong>in</strong>creas<strong>in</strong>g rates of teacher<br />
<strong>turnover</strong> have been effective at the state <strong>and</strong> local levels. However, the cumulative effects of<br />
these <strong>in</strong>itiatives have not been sufficient to halt the steady growth of <strong>turnover</strong> at the overall<br />
national level. The <strong>turnover</strong> of teachers <strong>in</strong> public schools has been costly to the field <strong>and</strong> a<br />
significant contributor to the shortage of sufficient numbers of qualified teachers <strong>in</strong> both <strong>special</strong><br />
<strong>and</strong> <strong>general</strong> <strong>education</strong>. There are three ma<strong>in</strong> approaches to deal<strong>in</strong>g with these problems: (a)<br />
<strong>in</strong>itiate renewed efforts to reduce each of the three types of <strong>turnover</strong>, (b) improve the<br />
management of the costs of teacher <strong>turnover</strong>, <strong>and</strong> (c) <strong>in</strong>crease the supply of qualified teachers.<br />
These approaches will be discussed <strong>in</strong> turn.<br />
Attrition<br />
Our analyses of teacher <strong>attrition</strong> are relevant to the issues of whether teacher shortages are<br />
mostly due to excessive <strong>attrition</strong> or to <strong>in</strong>adequate supply, <strong>and</strong> whether the most promis<strong>in</strong>g<br />
response to teacher shortages is exp<strong>and</strong>ed efforts to <strong>in</strong>crease the retention of employed teachers<br />
or, <strong>in</strong>stead, to <strong>in</strong>crease the supply of qualified teachers. Accord<strong>in</strong>g to Ingersoll (2001) <strong>and</strong><br />
NCTAF (2003), excessive <strong>attrition</strong> (therefore <strong>in</strong>adequate retention) is the crux of the teacher<br />
shortage problem because excessive <strong>attrition</strong> creates high dem<strong>and</strong> for hir<strong>in</strong>g enter<strong>in</strong>g teachers. In<br />
this view, teacher supply would be sufficient (except <strong>in</strong> several subjects) if it were not for such<br />
high dem<strong>and</strong> due to <strong>attrition</strong>.<br />
30
<strong>Teacher</strong> Turnover<br />
The results of our research do not support this view. Instead, the evidence presented here<br />
suggests that teacher <strong>attrition</strong> has not been excessive <strong>in</strong> comparison with other vocations. The<br />
<strong>attrition</strong> of both public school SETs <strong>and</strong> GETs was less than that <strong>in</strong> non-bus<strong>in</strong>ess occupations<br />
(<strong>and</strong> its health care component) dur<strong>in</strong>g the 1990s. In addition, Henke, Zahn, <strong>and</strong> Carroll (2001)<br />
found that the <strong>attrition</strong> of public <strong>and</strong> private teachers (comb<strong>in</strong>ed), dur<strong>in</strong>g their first three years,<br />
was among the lowest of several occupations studied. Thus, teach<strong>in</strong>g seems to be a reasonably<br />
appeal<strong>in</strong>g occupation <strong>in</strong> comparison with others. If teach<strong>in</strong>g were relatively unattractive,<br />
<strong>in</strong>itiatives to improve retention would have more promise of success. Consequently, the most<br />
promis<strong>in</strong>g approach to reduce teacher shortages is to <strong>in</strong>crease the supply of qualified teachers.<br />
Furthermore, the perception that the teach<strong>in</strong>g profession “eats its young” (e.g., Halford,<br />
1998) is not supported by our f<strong>in</strong>d<strong>in</strong>gs, even though beg<strong>in</strong>n<strong>in</strong>g teachers leave at a somewhat<br />
higher rate than experienced teachers before retirement age. Across four TFSs from 1988-89 to<br />
2000-01, Luekens et al. (2004) found that <strong>attrition</strong> was only about 2% higher for public teachers<br />
with 1–3 years of full-time teach<strong>in</strong>g experience than with 4-9 years. We found a similar<br />
difference for SETs <strong>and</strong> GETs separately, with data from the three most recent TFSs. These<br />
higher rates are concentrated <strong>in</strong> the first three years of teach<strong>in</strong>g, not the first five years. By years<br />
4 <strong>and</strong> 5, the <strong>attrition</strong> rates decl<strong>in</strong>e to the overall level seen for teachers with 4–9 years of<br />
experience (Boe, Cook, & Sunderl<strong>and</strong>, 2005). A somewhat higher rate of <strong>attrition</strong> for beg<strong>in</strong>n<strong>in</strong>g<br />
teachers should be expected as they assess the fit of their qualifications <strong>and</strong> <strong>in</strong>terests to the<br />
dem<strong>and</strong>s of classroom teach<strong>in</strong>g. As others have noted as well, some beg<strong>in</strong>n<strong>in</strong>g teachers are<br />
lack<strong>in</strong>g <strong>in</strong> these respects <strong>and</strong> should leave (e.g., NCES, 2005; Johnson et al., 2004).<br />
The results of our research also <strong>in</strong>dicate that that there is limited potential for policy<br />
<strong>in</strong>itiatives <strong>and</strong> improvements <strong>in</strong> practice to reduce the <strong>attrition</strong> of qualified teachers <strong>in</strong> public<br />
schools. 0nly about one-quarter of teacher <strong>attrition</strong> <strong>in</strong> <strong>general</strong> <strong>education</strong> <strong>and</strong> one-third <strong>in</strong> <strong>special</strong><br />
<strong>education</strong> are due ma<strong>in</strong>ly to teachers who seek better opportunities <strong>in</strong> other vocations or who are<br />
otherwise dissatisfied with teach<strong>in</strong>g. It is reasonable to expect that dramatic improvements <strong>in</strong><br />
<strong>in</strong>duction programs, work<strong>in</strong>g conditions, adm<strong>in</strong>istrative support, <strong>and</strong> salaries would reduce the<br />
<strong>attrition</strong> of a sizable percentage of this group. But such work-place improvements would likely<br />
have only modest impact on the majority of teachers who leave, i.e., those who leave for<br />
personal reasons, poor health, job actions, <strong>and</strong> retirement.<br />
31
<strong>Teacher</strong> Turnover<br />
Thus, the results of our research for both public SETs <strong>and</strong> GETs do not support NCTAF’s<br />
(2003) perspective that <strong>in</strong>adequate teacher retention has become a national crisis. Instead,<br />
retention seems to have been as high as might reasonably be expected under prevail<strong>in</strong>g<br />
conditions. Substantial improvement <strong>in</strong> teacher retention would require massive systemic<br />
changes <strong>in</strong> the culture of public school<strong>in</strong>g <strong>and</strong> even greater allocation of public funds. In spite of<br />
enormous efforts to improve public <strong>education</strong> dur<strong>in</strong>g the past two decades, teacher <strong>attrition</strong> has<br />
<strong>in</strong>creased. Given this, it is unrealistic to expect a level of susta<strong>in</strong>ed national commitment of<br />
sufficient scope to reduce substantially teacher <strong>attrition</strong>. Even conta<strong>in</strong><strong>in</strong>g its growth will be<br />
difficult. The implication is that it will be more productive for the field of <strong>education</strong> to make<br />
shrewd <strong>in</strong>vestments <strong>in</strong> <strong>in</strong>creas<strong>in</strong>g teacher supply than <strong>in</strong> reduc<strong>in</strong>g <strong>attrition</strong>.<br />
In these respects, the <strong>attrition</strong> component of teacher <strong>turnover</strong> is quite different than teach<strong>in</strong>g<br />
area transfer <strong>and</strong> school migration <strong>in</strong> that only about a quarter of <strong>attrition</strong> is ma<strong>in</strong>ly job-related<br />
(most is for personal reasons <strong>and</strong> retirement), whereas transfer <strong>and</strong> migration are largely due to<br />
job related considerations as discussed below. Consequently, there may be more potential for<br />
<strong>education</strong>al policy <strong>in</strong>terventions to reduce transfer <strong>and</strong> migration.<br />
Teach<strong>in</strong>g Area Transfer<br />
Even though teach<strong>in</strong>g area transfer (one type of <strong>turnover</strong>) poses serious problems for<br />
staff<strong>in</strong>g schools, its study has been neglected with large scale national data. Our results<br />
demonstrate that a somewhat higher percentage of SETs transfer to teach<strong>in</strong>g assignments <strong>in</strong><br />
<strong>general</strong> <strong>education</strong> than leave teach<strong>in</strong>g employment. However, teach<strong>in</strong>g area transfer is<br />
characteristic of the entire teach<strong>in</strong>g force. S<strong>in</strong>ce both SETs <strong>and</strong> GETs transferred among teach<strong>in</strong>g<br />
areas at comparable rates, teach<strong>in</strong>g area transfer of SETs was not excessive by comparison.<br />
Without more <strong>in</strong>formation, it is not possible to determ<strong>in</strong>e whether the rate of teach<strong>in</strong>g area<br />
transfer of GETs has been excessive. In spite of <strong>in</strong>itiatives that may have been made to reduce<br />
teach<strong>in</strong>g area transfer, our results show it has been an endur<strong>in</strong>g <strong>and</strong> <strong>in</strong>creas<strong>in</strong>g phenomenon.<br />
While the annual rates of teach<strong>in</strong>g area transfer were high for both SETs <strong>and</strong> GETs (over<br />
10% <strong>in</strong> 2000-01), the number of teachers transferr<strong>in</strong>g between <strong>special</strong> <strong>and</strong> <strong>general</strong> <strong>education</strong> was<br />
not significantly different. Thus, there was no net loss (or ga<strong>in</strong>) to <strong>special</strong> <strong>education</strong> <strong>in</strong> the<br />
number of teachers transferr<strong>in</strong>g between these two broad fields.<br />
There is some evidence from state-level data as to why SETs switch to teach<strong>in</strong>g assignments<br />
<strong>in</strong> <strong>general</strong> <strong>education</strong>. One reason is that some beg<strong>in</strong>n<strong>in</strong>g SETs, who were prepared to teach <strong>in</strong><br />
32
<strong>Teacher</strong> Turnover<br />
<strong>general</strong> <strong>education</strong>, later found a teach<strong>in</strong>g position for which they were more qualified (Schrag &<br />
Theobald, 1989). Other research <strong>in</strong>dicates that SETs switch to <strong>general</strong> <strong>education</strong> due to high<br />
stress <strong>and</strong> <strong>in</strong>sufficient adm<strong>in</strong>istrative support (Bill<strong>in</strong>gsley & Cross, 1991). Unfortunately, TFS<br />
did not collect <strong>in</strong>formation nationally from SETs about their ma<strong>in</strong> reason for transferr<strong>in</strong>g to<br />
<strong>general</strong> <strong>education</strong>, or from GETs about their ma<strong>in</strong> reason for transferr<strong>in</strong>g among teach<strong>in</strong>g fields.<br />
These f<strong>in</strong>d<strong>in</strong>gs suggest some potential for reduc<strong>in</strong>g the out-switch<strong>in</strong>g of SETs. First,<br />
improvement is clearly needed <strong>in</strong> the size of the supply of <strong>in</strong>dividuals prepared for teach<strong>in</strong>g <strong>in</strong><br />
<strong>special</strong> <strong>education</strong>. No doubt because the supply of such <strong>in</strong>dividuals was <strong>in</strong>sufficient, 18% of<br />
first-time teachers hired <strong>in</strong>to <strong>special</strong> <strong>education</strong> <strong>in</strong> 1999-00 had been prepared for teach<strong>in</strong>g <strong>in</strong><br />
<strong>general</strong> <strong>education</strong> (Cook & Boe, <strong>in</strong> press). Likewise, stress reduction <strong>and</strong> improvement <strong>in</strong> the<br />
adm<strong>in</strong>istrative support for SETs may be possible, as advocated by Kozleski et al. (2004).<br />
Nonetheless, as shown here, the national rates of teach<strong>in</strong>g area transfer for both SETs <strong>and</strong> GETs<br />
<strong>in</strong>creased rapidly dur<strong>in</strong>g a recent decade. Consequently, it is unrealistic to expect <strong>in</strong>terventions of<br />
sufficient national scope to reduce substantially teach<strong>in</strong>g area transfer. Even conta<strong>in</strong><strong>in</strong>g its<br />
growth will be difficult.<br />
School Migration<br />
As we have shown, SETs moved to a different school at a significantly higher rate than<br />
GETs (10.2% vs. 7.4%, <strong>in</strong> 2000-01). In this comparison, the migration of SETs appears to have<br />
been excessive. Without more <strong>in</strong>formation, however, it is not possible to determ<strong>in</strong>e whether the<br />
migration rate of GETs was excessive. Nonetheless, a mover is just as costly to a school as a<br />
leaver is even though school migration does not represent a loss to the national teach<strong>in</strong>g force<br />
(e.g., Ingersoll, 2001).<br />
Unfortunately, we do not have specific <strong>in</strong>formation to report on the reasons for SET<br />
migration. From this research, we have shown that over half the amount of school migration of<br />
both SETs <strong>and</strong> GETs occurred between schools with<strong>in</strong> the same school district. In prior national<br />
research based on all public school teachers, the ma<strong>in</strong> reason for with<strong>in</strong>-district migration was<br />
<strong>in</strong>voluntary on the part of teachers (i.e., 51% was due to school staff<strong>in</strong>g actions) (Boe et al.,<br />
1999). Thus, <strong>education</strong> adm<strong>in</strong>istrators are responsible for a considerable amount of migration.<br />
Based on TFS data for 2000-01, Luekens et al. (2004) computed the percentage of all public<br />
school teachers who rated various reasons for mov<strong>in</strong>g as very important or extremely important.<br />
By far, the two most important reasons (reported by about 40% of movers) were opportunity for<br />
33
<strong>Teacher</strong> Turnover<br />
a better teach<strong>in</strong>g assignment (subject area or grade level) <strong>and</strong> dissatisfaction with adm<strong>in</strong>istrative<br />
support at the previous school.<br />
Even though the major factors driv<strong>in</strong>g school migration (staff<strong>in</strong>g actions, unfavorable<br />
teach<strong>in</strong>g assignments, <strong>and</strong> <strong>in</strong>adequate adm<strong>in</strong>istrative support) are subject to adm<strong>in</strong>istrative<br />
<strong>in</strong>terventions, migration held steady at a fairly high level dur<strong>in</strong>g the 1990s. Either <strong>in</strong>terventions<br />
<strong>in</strong>tended to reduce migration have not been successful, or policy makers have not <strong>in</strong>itiated such<br />
<strong>in</strong>terventions. Consequently, it is not realistic to expect that the management of public <strong>education</strong><br />
will be improved sufficiently <strong>in</strong> the foreseeable future to reduce teacher migration substantially.<br />
Manag<strong>in</strong>g Turnover<br />
We recognize that high teacher <strong>turnover</strong> has been a costly <strong>and</strong> endur<strong>in</strong>g problem. It should<br />
cont<strong>in</strong>ue to be the subject of research <strong>and</strong> policy attention with a view to identify<strong>in</strong>g feasible<br />
practices that will improve retention. Nonetheless, <strong>turnover</strong> is endemic to public <strong>education</strong> as<br />
currently organized. So long as this cont<strong>in</strong>ues, other approaches to reduc<strong>in</strong>g the costs of <strong>turnover</strong><br />
should be designed <strong>and</strong> implemented. One of these is to improve the management of <strong>turnover</strong>.<br />
With about one <strong>in</strong> four teach<strong>in</strong>g assignments turn<strong>in</strong>g over every year as the national average, the<br />
task of manag<strong>in</strong>g these transitions is enormous.<br />
In manag<strong>in</strong>g <strong>turnover</strong>, it should be recognized that a substantial majority of <strong>in</strong>dividuals<br />
<strong>in</strong>volved are experienced teachers <strong>in</strong>stead of first-time teachers. All teachers switch<strong>in</strong>g teach<strong>in</strong>g<br />
fields <strong>and</strong> mov<strong>in</strong>g to a different school have teach<strong>in</strong>g experience, as do half of new entrants <strong>in</strong>to<br />
public school teach<strong>in</strong>g (the other half are first-time teachers) (Cook & Boe, <strong>in</strong> press). Thus, of<br />
the total annual <strong>turnover</strong> reported here, about 85% of teachers <strong>in</strong>volved have teach<strong>in</strong>g<br />
experience. Manag<strong>in</strong>g the costs of <strong>turnover</strong>, therefore, should be focused on issues associated<br />
with the <strong>turnover</strong> of experienced teachers—e<strong>special</strong>ly the 70% of annual <strong>turnover</strong> represented by<br />
teach<strong>in</strong>g area transfer <strong>and</strong> school migration.<br />
One cost of teacher <strong>turnover</strong> is organizational—a cost that can be managed by school<br />
personnel. With respect to teachers new to their assignment, it is important to m<strong>in</strong>imize<br />
disruption <strong>in</strong> <strong>in</strong>structional programs by provid<strong>in</strong>g them with the perspectives, knowledge, <strong>and</strong><br />
skills required to susta<strong>in</strong> the effective function<strong>in</strong>g of ongo<strong>in</strong>g school programs, <strong>and</strong> to <strong>in</strong>tegrate<br />
them <strong>in</strong>to the faculty by open<strong>in</strong>g l<strong>in</strong>es of communication <strong>and</strong> build<strong>in</strong>g cohesion (e.g., Johnson et<br />
al, 2005).<br />
34
<strong>Teacher</strong> Turnover<br />
To accomplish this, schools might reduce the organizational costs of <strong>turnover</strong> by offer<strong>in</strong>g<br />
more varied <strong>and</strong> extensive <strong>in</strong>duction programs tailored to a variety of specific circumstances.<br />
Induction programs currently exist particularly for <strong>in</strong>dividuals beg<strong>in</strong>n<strong>in</strong>g their first year of<br />
teach<strong>in</strong>g. These, of course, should be reta<strong>in</strong>ed <strong>and</strong> improved as needed. In addition, different<br />
k<strong>in</strong>ds of <strong>in</strong>duction programs should be designed <strong>and</strong> provided for the major <strong>in</strong>flux of experienced<br />
teachers <strong>in</strong>to open positions, i.e., for those reenter<strong>in</strong>g teach<strong>in</strong>g employment, mov<strong>in</strong>g from<br />
different schools, <strong>and</strong> switch<strong>in</strong>g teach<strong>in</strong>g assignments (e.g., from <strong>general</strong> to <strong>special</strong> <strong>education</strong>).<br />
Another approach to reduc<strong>in</strong>g the organizational costs of <strong>turnover</strong> is more st<strong>and</strong>ardization of<br />
curriculum <strong>and</strong> <strong>in</strong>struction. The greater the similarity between a teacher’s tra<strong>in</strong><strong>in</strong>g/experience<br />
<strong>and</strong> the requirements of a new teach<strong>in</strong>g assignment, the easier it will be for the teacher to<br />
perform effectively. While most schools will <strong>in</strong>sist on reta<strong>in</strong><strong>in</strong>g the freedom to <strong>in</strong>novate <strong>and</strong> to<br />
design programs tailored to local needs, a consequence will cont<strong>in</strong>ue to be difficulties <strong>in</strong><br />
<strong>in</strong>duct<strong>in</strong>g a substantial percentage of new teachers annually.<br />
Another cost of teacher <strong>turnover</strong> is f<strong>in</strong>ancial. As reviewed by Johnson, et al. (2005),<br />
estimates of <strong>turnover</strong> costs vary widely <strong>and</strong> depend on many variables. The conclusion is<br />
<strong>in</strong>escapable, nonetheless, that the f<strong>in</strong>ancial cost of the three types of <strong>turnover</strong> is enormous<br />
nationally. Based on U.S. Department of Labor <strong>turnover</strong> cost estimates, the Alliance for<br />
Excellent Education (2005) computed replacement costs of about $4.9 billion annually for<br />
teachers who leave teach<strong>in</strong>g employment <strong>and</strong> who move to another school. Whatever the huge<br />
f<strong>in</strong>ancial cost of teacher <strong>turnover</strong>, it must be paid. The development of more f<strong>in</strong>ancially efficient<br />
methods for manag<strong>in</strong>g teacher <strong>turnover</strong> is needed. This represents an important objective for<br />
<strong>education</strong> policy makers, executives, <strong>and</strong> researchers.<br />
<strong>Teacher</strong> Supply<br />
Another approach to the costs of teacher <strong>turnover</strong> is to <strong>in</strong>crease the supply of qualified<br />
teachers. The national shortage of qualified teachers <strong>in</strong> many fields is due either to excessive<br />
dem<strong>and</strong> due to <strong>attrition</strong>, or to <strong>in</strong>sufficient supply, or both. Our conclusions from this research are<br />
that teacher <strong>attrition</strong> is not excessive <strong>in</strong> comparison with other vocations, <strong>and</strong> that retention will<br />
not improve substantially unless prevail<strong>in</strong>g conditions improve dramatically. S<strong>in</strong>ce this is<br />
unlikely, the supply of qualified teachers needs to be <strong>in</strong>creased sufficiently to satisfy dem<strong>and</strong>.<br />
Although the topic of teacher supply is too large <strong>and</strong> complex to be reviewed here (see Cook<br />
& Boe, <strong>in</strong> press; Curran & Abrahams, 2000; NCES, 2005), we use <strong>special</strong> <strong>education</strong> to illustrate<br />
35
<strong>Teacher</strong> Turnover<br />
the need for enhanced supply. Of first-time SETs hired <strong>in</strong> 1999-00, only 46% were extensively<br />
prepared to teach <strong>in</strong> <strong>special</strong> <strong>education</strong> (the others were either prepared <strong>in</strong> <strong>general</strong> <strong>education</strong> or<br />
had <strong>in</strong>adequate preparation) (Cook & Boe). It is not surpris<strong>in</strong>g that <strong>in</strong>adequate supply <strong>in</strong>creases<br />
<strong>turnover</strong> as many SETs switch to assignments <strong>in</strong> <strong>general</strong> <strong>education</strong> for which they prepared.<br />
Benefits of Turnover<br />
Although the costs of teacher <strong>turnover</strong> are a major concern, the benefits of teacher <strong>turnover</strong><br />
should also be recognized <strong>and</strong> better understood. Unfortunately, these benefits are a neglected<br />
area of research. Our results, however, document some benefits. Of SETs who leave each year,<br />
about half are replaced by return<strong>in</strong>g experienced teachers (this was about 38% for GETs). This is<br />
<strong>in</strong>deed a “revolv<strong>in</strong>g door,” but the fact that so many former teachers return is a major asset to the<br />
field. Nonetheless, teacher <strong>turnover</strong> still entails costs, but the costs for tra<strong>in</strong><strong>in</strong>g more first-time<br />
teachers would be even higher were it not for return<strong>in</strong>g experienced teachers.<br />
In addition, much of the <strong>attrition</strong> of teachers is an asset to the field of <strong>education</strong> s<strong>in</strong>ce about<br />
one third of leavers became employed <strong>in</strong> non-teach<strong>in</strong>g positions <strong>in</strong> <strong>education</strong>. As we have<br />
shown, over four times as many leavers became employed <strong>in</strong> non-teach<strong>in</strong>g positions <strong>in</strong> <strong>education</strong><br />
the year after leav<strong>in</strong>g than became employed <strong>in</strong> other vocations.<br />
A somewhat higher rate of <strong>attrition</strong> of teachers dur<strong>in</strong>g their first three years of experience is<br />
not surpris<strong>in</strong>g, <strong>and</strong> some is probably constructive. New teachers explore the fit of their <strong>in</strong>terests<br />
<strong>and</strong> qualifications for the dem<strong>and</strong>s of the profession. Not all are suited, <strong>and</strong> hence should leave<br />
(NCTAF, 2003; NCES, 2005; Johnson et al., 2005). And as Wayne (2000) concluded, only one<br />
quarter of beg<strong>in</strong>n<strong>in</strong>g teachers leave to pursue other careers or due to dissatisfaction. Given these<br />
considerations, the somewhat higher rate of <strong>attrition</strong> for public school teachers with 1-3 years of<br />
experience is not alarm<strong>in</strong>g <strong>and</strong> some of it is constructive.<br />
Implications for Turnover Research<br />
Compared with the extensive analysis of teacher <strong>attrition</strong>, <strong>and</strong> reasons therefore, reported<br />
here <strong>and</strong> elsewhere, much more research should be devoted to underst<strong>and</strong><strong>in</strong>g the reasons for<br />
teach<strong>in</strong>g area transfer <strong>and</strong> school migration, <strong>and</strong> for <strong>in</strong>terventions that improve the retention of<br />
qualified teachers. In addition, a much better empirical underst<strong>and</strong><strong>in</strong>g of the costs <strong>and</strong> benefits of<br />
teacher <strong>turnover</strong> will be useful <strong>in</strong> assess<strong>in</strong>g tradeoffs <strong>and</strong> target<strong>in</strong>g <strong>in</strong>terventions.<br />
36
<strong>Teacher</strong> Turnover<br />
TFS data on teacher <strong>turnover</strong> represent a one-year change. To supplement this, more<br />
research with long-range longitud<strong>in</strong>al data such as from the 10-year B&B study is needed to<br />
provide more detailed <strong>and</strong> precise <strong>in</strong>formation about <strong>turnover</strong> phenomena.<br />
Conclusions<br />
A high rate of annual teacher <strong>turnover</strong> has been an endur<strong>in</strong>g aspect of the teach<strong>in</strong>g<br />
profession, <strong>and</strong> will almost certa<strong>in</strong>ly rema<strong>in</strong> so <strong>in</strong> the foreseeable future unless dramatic<br />
improvements are made <strong>in</strong> the organization, management, <strong>and</strong> fund<strong>in</strong>g of public schools. Until<br />
then, <strong>in</strong>creased supply of qualified teachers is needed to reduce teacher shortages created <strong>in</strong> large<br />
part by teacher <strong>turnover</strong>. In addition, the field of <strong>education</strong> should improve its underst<strong>and</strong><strong>in</strong>g of<br />
the costs <strong>and</strong> benefits of <strong>turnover</strong>, <strong>and</strong> improve its management of <strong>turnover</strong> <strong>in</strong> order to reduce its<br />
costs <strong>and</strong> enhance its benefits.<br />
We recognize that rates of teacher <strong>turnover</strong> are exceptionally high <strong>in</strong> some teach<strong>in</strong>g fields<br />
<strong>and</strong> types of schools (Guar<strong>in</strong>o et al., 2006) where <strong>in</strong>terventions <strong>in</strong>tended to improve retention<br />
might well be effective <strong>and</strong> beneficial even though hav<strong>in</strong>g m<strong>in</strong>imal impact on aggregate national<br />
rates. Fortunately, measures taken to improve teacher retention (e.g., better work<strong>in</strong>g conditions<br />
<strong>and</strong> higher salaries) will also make the teach<strong>in</strong>g profession more attractive as a career choice, <strong>and</strong><br />
therefore will likely serve to <strong>in</strong>crease teacher supply.<br />
37
<strong>Teacher</strong> Turnover<br />
References<br />
Alliance for Excellent Education (2005). <strong>Teacher</strong> <strong>attrition</strong>: A costly loss to the nation <strong>and</strong> to<br />
the states (Issue Brief). Wash<strong>in</strong>gton, DC: Author.<br />
Bill<strong>in</strong>gsley, B. S. (2004). Special <strong>education</strong> teacher retention <strong>and</strong> <strong>attrition</strong>: A critical analysis<br />
of the research literature. Journal of Special Education, 38(1), 39-55.<br />
Bill<strong>in</strong>gsley, B. S. (2005). Cultivat<strong>in</strong>g <strong>and</strong> keep<strong>in</strong>g committed <strong>special</strong> <strong>education</strong> teachers:<br />
What pr<strong>in</strong>cipals <strong>and</strong> district leaders can do. Thous<strong>and</strong> Oaks, CA: Corw<strong>in</strong> Press.<br />
Bill<strong>in</strong>gsley, B. S., & Cross, L. H. (1991). <strong>Teacher</strong>s' decisions to transfer from <strong>special</strong> to<br />
<strong>general</strong> <strong>education</strong>. The Journal of Special Education, 24, 496-511.<br />
Bobbitt, S. A., Leich, M. C., Whitener, S. D., & Lynch, H. F. (1994). Characteristics of<br />
stayers, movers, <strong>and</strong> leavers: Results from the <strong>Teacher</strong> Followup Survey, 1991-92 (NCES 94-<br />
337). Wash<strong>in</strong>gton, DC: National Center for Education Statistics, U.S. Department of Education.<br />
Boe, E. E., Barkanic, G., & Leow, C. S. (1999). Retention <strong>and</strong> Attrition of <strong>Teacher</strong>s at the<br />
School Level: National Trends <strong>and</strong> Predictors. (Data Analysis Rep. No. 1999-DAR1).<br />
Philadelphia: University of Pennsylvania, Graduate School of Education, Center for Research<br />
<strong>and</strong> Evaluation <strong>in</strong> Social Policy. (ERIC Document Reproduction Service No. Ed 436 485)<br />
Boe, E. E., Bobbitt, S. A., Cook, L. H., & Barkanic, G. (1998). National Trends <strong>in</strong> <strong>Teacher</strong><br />
Supply <strong>and</strong> Turnover for Special <strong>and</strong> General Education. (Data Analysis Rep. No. 1998-DAR1).<br />
Philadelphia: University of Pennsylvania, Graduate School of Education, Center for Research<br />
<strong>and</strong> Evaluation <strong>in</strong> Social Policy. (ERIC Document Reproduction Service No. Ed 426 549)<br />
Boe, E. E., Bobbitt, S. A., Cook, L. H., Barkanic, G., & Maisl<strong>in</strong>, G. (1998). <strong>Teacher</strong><br />
Turnover <strong>in</strong> Eight Cognate Areas: National Trends <strong>and</strong> Predictors. (Data Analysis Rep. No.<br />
1998-DAR3). Philadelphia: University of Pennsylvania, Graduate School of Education, Center<br />
for Research <strong>and</strong> Evaluation <strong>in</strong> Social Policy.<br />
Boe, E. E., Cook, L. H., & Sunderl<strong>and</strong>, R. J. (2005, July). Turnover of <strong>special</strong> <strong>education</strong><br />
teachers: New research on the extent <strong>and</strong> impact of exit <strong>attrition</strong>, transfer to <strong>general</strong> <strong>education</strong>,<br />
<strong>and</strong> school transfer. Paper presented at the 2005 OSEP Project Directors Conference,<br />
Wash<strong>in</strong>gton, DC.<br />
Boe, E. E., & Gilford, D. M. (Eds.) (1992). <strong>Teacher</strong> supply, dem<strong>and</strong>, <strong>and</strong> quality: Policy<br />
issues, models, <strong>and</strong> data bases. Wash<strong>in</strong>gton, DC: National Academy Press.<br />
Bureau of National Affairs (1992). BNA's quarterly report on job absence <strong>and</strong> <strong>turnover</strong>: 4 th<br />
quarter 1991. Bullet<strong>in</strong> to Management (March 12). Wash<strong>in</strong>gton, DC: Author.<br />
Bureau of National Affairs (1995). BNA's quarterly report on job absence <strong>and</strong> <strong>turnover</strong>: 4 th<br />
quarter 1994. Bullet<strong>in</strong> to Management (March 9). Wash<strong>in</strong>gton, DC: Author.<br />
38
<strong>Teacher</strong> Turnover<br />
Bureau of National Affairs (1999). BNA's quarterly report on job absence <strong>and</strong> <strong>turnover</strong>: 4 th<br />
quarter 1998. Bullet<strong>in</strong> to Management (Vol. 50, No. 10 -- Part II). Wash<strong>in</strong>gton, DC: Author.<br />
Bureau of National Affairs (2000). Job absence & <strong>turnover</strong>: 4 th quarter 1999. Bullet<strong>in</strong> to<br />
Management (Vol. 51, No. 10 -- Part II). Wash<strong>in</strong>gton, DC: Author.<br />
Bureau of National Affairs (2001). Job absence & <strong>turnover</strong>: 4 th quarter 2000. Bullet<strong>in</strong> to<br />
Management (Vol. 52, No. 10 -- Part II). Wash<strong>in</strong>gton, DC: Author.<br />
Bureau of National Affairs (2002). Job absence & <strong>turnover</strong>: 4 th quarter 2001. Bullet<strong>in</strong> to<br />
Management (Vol. 53, No. 11 -- Part II). Wash<strong>in</strong>gton, DC: Author.<br />
Center on Education Policy (2006). Basic (<strong>and</strong> sometimes surpris<strong>in</strong>g) facts about the U.S.<br />
<strong>education</strong> system: A public <strong>education</strong> primer. Wash<strong>in</strong>gton, DC: Author.<br />
Choy, S. P., Henke, R. R., Alt, M. N., Medrich, E. A., & Bobbitt, S. A. (1993). Schools <strong>and</strong><br />
staff<strong>in</strong>g <strong>in</strong> the United States: A statistical profile, 1990-91. Wash<strong>in</strong>gton, DC: National Center for<br />
Education Statistics, U.S. Department of Education.<br />
Cook, L. H., & Boe, E. E. (<strong>in</strong> press). National trends <strong>in</strong> the sources of supply of teachers <strong>in</strong><br />
<strong>special</strong> <strong>and</strong> <strong>general</strong> <strong>education</strong>. <strong>Teacher</strong> Education <strong>and</strong> Special Education<br />
.<br />
Curran, B, & Abrahams, C. (2000, January). <strong>Teacher</strong> supply <strong>and</strong> dem<strong>and</strong>: Is there a<br />
shortage? Issue Brief, Retrieved July 3, 2003, from the National Governors’ Association Center<br />
for Best Practices website: http://www.nga.org/center/divisions/1,1188,C_ISSUE-<br />
BRIEF^D_532,00.html<br />
Guar<strong>in</strong>o, C. M., Santibanez, L., & Daley, G. A. (2006). <strong>Teacher</strong> recruitment <strong>and</strong> retention: A<br />
review of the recent empirical literature. Review of Educational Research, 76(2), 173-208.<br />
Halford, J. (1998). Eas<strong>in</strong>g the way for new teachers. Educational Leadership, 55(5), 33-36.<br />
Hanushek, E. A., Ka<strong>in</strong>, J. G., & Rivk<strong>in</strong>, S. G. (2004). The revolv<strong>in</strong>g door: Factors affect<strong>in</strong>g<br />
teacher <strong>turnover</strong>. In W. J. Fowler, Jr. (Ed.), Developments <strong>in</strong> school f<strong>in</strong>ance: 2003: Fiscal<br />
proceed<strong>in</strong>gs from the annual state data conference of July 2003 (pp. 5-15). Wash<strong>in</strong>gton, DC:<br />
National Center for Education Statistics, U.S. Department of Education.<br />
Henke, R. R., Chen, X., Geis, S., & Knepper, P. (2000). Progress through the teacher<br />
pipel<strong>in</strong>e: 1992-93 college graduates <strong>and</strong> elementary/secondary school teach<strong>in</strong>g as of 1997.<br />
Wash<strong>in</strong>gton, DC: National Center for Education Statistics, U.S. Department of Education.<br />
Henke, R. R., Choy, S. P., Chen, X., Geis, S., Alt, M. N., & Broughman, S. P. (1997).<br />
America's teachers: Profile of a profession, 1993-94. Wash<strong>in</strong>gton, DC: National Center for<br />
Education Statistics, U.S. Department of Education.<br />
39
<strong>Teacher</strong> Turnover<br />
Henke, R. R., Choy, S. P., Geis, S., & Broughman, S. P. (1996). Schools <strong>and</strong> staff<strong>in</strong>g <strong>in</strong> the<br />
United States: A statistical profile, 1993-94. Wash<strong>in</strong>gton, DC: National Center for Education<br />
Statistics, U.S. Department of Education.<br />
Henke, R. R., Zahn, L., & Carroll, C. D. (2001). Attrition of new teachers among recent<br />
college graduates: Compar<strong>in</strong>g occupational stability among 1992-93 graduates who taught <strong>and</strong><br />
those who worked <strong>in</strong> other occupations. Wash<strong>in</strong>gton, DC: National Center for Education<br />
Statistics, U.S. Department of Education.<br />
Ingersoll, R. M. (1997). <strong>Teacher</strong> <strong>turnover</strong> <strong>and</strong> teacher quality: The recurr<strong>in</strong>g myth of teacher<br />
shortages. <strong>Teacher</strong>s College Record, 91(1), 41-44.<br />
Ingersoll, R. M. (2001). <strong>Teacher</strong> <strong>turnover</strong> <strong>and</strong> teacher shortages: An organizational analysis.<br />
American Educational Research Journal, 38(3), 499-534.<br />
Ingersoll, R. M. (2002). The teacher shortage: A case of wrong diagnosis <strong>and</strong> wrong<br />
prescription. NASSP Bullet<strong>in</strong>, 86(631), 16-31.<br />
Ingersoll, R. M. (2003). Is there really a teacher shortage? A research report (Document R-<br />
03-4). Seattle, WA: University of Wash<strong>in</strong>gton, Center for the Study of Teach<strong>in</strong>g <strong>and</strong> Policy.<br />
Johnson, S. M., Berg, J. H., & Donaldson, M. L. (2005). Who stays <strong>in</strong> teach<strong>in</strong>g <strong>and</strong> why? A<br />
review of the literature on teacher retention. Cambridge, MA: Harvard Graduate School of<br />
Education.<br />
Kozleski, E., Ma<strong>in</strong>zer, R., & Deshler, D. (2004). Bright futures for exceptional learners: An<br />
action agenda to achieve quality conditions for teach<strong>in</strong>g <strong>and</strong> learn<strong>in</strong>g. Reston, VA: Council for<br />
Exceptional Children.<br />
Luekens, M. T., Lyter, D. M., & Fox, E. E. (2004). <strong>Teacher</strong> <strong>attrition</strong> <strong>and</strong> mobility: Results<br />
from the <strong>Teacher</strong> Follow-up Survey, 2000-01 (NCES 2004-301). U.S. Department of Education,<br />
National Center for Education Statistics. Wash<strong>in</strong>gton, DC: Government Pr<strong>in</strong>t<strong>in</strong>g Office.<br />
McLeskey, J. (2005) Forward. In B. S. Bill<strong>in</strong>gsley, Cultivat<strong>in</strong>g <strong>and</strong> keep<strong>in</strong>g committed<br />
<strong>special</strong> <strong>education</strong> teachers: What pr<strong>in</strong>cipals <strong>and</strong> district leaders can do (pp. xvi-xix). Thous<strong>and</strong><br />
Oaks, CA: Corw<strong>in</strong> Press.<br />
McLeskey, J., Tyler, N.C., & Flipp<strong>in</strong>, S.S. (2004). The supply <strong>and</strong> dem<strong>and</strong> for <strong>special</strong><br />
<strong>education</strong> teachers: A review of research regard<strong>in</strong>g the chronic shortage of <strong>special</strong> <strong>education</strong><br />
teachers. Journal of Special Education, 38 (1), 5-21.<br />
National Center for Education Statistics (2005). The condition of <strong>education</strong> 2005 (NCES<br />
2005-094). Wash<strong>in</strong>gton, DC: U.S. Government Pr<strong>in</strong>t<strong>in</strong>g Office.<br />
National Commission on Teach<strong>in</strong>g <strong>and</strong> America's Future (2003). No dream denied: A<br />
Pledge to America’s children. New York: Author.<br />
40
<strong>Teacher</strong> Turnover<br />
Podgursky, M. (2006). Is there a “Qualified <strong>Teacher</strong>” shortage? Education Next, 6(2), 27-32.<br />
Schrag, J. A. & Theobald, N. D. (1989). The adequacy of current <strong>and</strong> projected <strong>special</strong><br />
<strong>education</strong> personnel supply <strong>in</strong> Wash<strong>in</strong>gton State. Olympia, WA: Office of the Super<strong>in</strong>tendent of<br />
Public Instruction, Division of Special Services <strong>and</strong> Support Programs.<br />
Seastrom, M. M., Gruber, K. J., Henke, R., McGrath, D. J., & Cohen, B. A. (2002).<br />
Qualifications of the public school teacher workforce: Prevalence of out-of-field teach<strong>in</strong>g 1987-<br />
88 to 1999-2000 (NCES 2002-603). Wash<strong>in</strong>gton, DC: National Center for Education Statistics,<br />
U.S. Department of Education.<br />
Smith, T. M., & Ingersoll, R. M. (2004). What are the effects of <strong>in</strong>duction <strong>and</strong> mentor<strong>in</strong>g on<br />
beg<strong>in</strong>n<strong>in</strong>g teacher <strong>turnover</strong>? American Educational Research Journal, 41(3), 681-714.<br />
The Teach<strong>in</strong>g Commission (2006). Teach<strong>in</strong>g at risk: Progress & potholes. New York, NY:<br />
Author.<br />
Tourk<strong>in</strong>, S. C., Pugh, K. W,, Fondelier, S. E., Parmer, R. J., Cole, C., Jackson, B., Warner,<br />
T., Weant, G., & Walter, E. (2004). 1999– 2000 Schools <strong>and</strong> Staff<strong>in</strong>g Survey (SASS) Data File<br />
User’s Manual (NCES 2004–303). Wash<strong>in</strong>gton, DC: U.S. Department of Education.<br />
Whitener, S. D., Gruber, K. J., & Lynch, H., T<strong>in</strong>gos, K, Perona, M., & Fondelier, S. (1997).<br />
Characteristics of stayers, movers, <strong>and</strong> leavers: Results from the <strong>Teacher</strong> Followup Survey,<br />
1994-95 (NCES 97-450). Wash<strong>in</strong>gton, DC: National Center for Education Statistics, U.S.<br />
Department of Education.<br />
Wayne, A. J. (2000). <strong>Teacher</strong> supply <strong>and</strong> dem<strong>and</strong>: Surprises from primary research.<br />
Education Policy Analysis Archives, 8(47). Retrieved March 25, 2004, from<br />
http://epaa.asu.edu/epaa/v8n47.html<br />
41
<strong>Teacher</strong> Turnover<br />
APPENDIX A<br />
Sample Size Table<br />
42
<strong>Teacher</strong> Turnover<br />
Table A-1. SASS <strong>and</strong> TFS Public School <strong>Teacher</strong>s: Numbers of Completed Interviews Available for Secondary Analyses from the<br />
1990-92, 1993-95, <strong>and</strong> 1999-02 SASS/TFS Adm<strong>in</strong>istrations<br />
SASS a<br />
TFS a<br />
Turnover<br />
Public Education:<br />
<strong>Teacher</strong> Field<br />
School<br />
Year<br />
<strong>Teacher</strong><br />
Sample<br />
Response<br />
Rate c<br />
School<br />
Year<br />
<strong>Teacher</strong> b<br />
Sample<br />
Response<br />
Rate d<br />
Leavers<br />
Sample<br />
Switchers e<br />
Sample<br />
Movers e<br />
Sample<br />
Special Education 1990-91 5,054 1991-92 584 145 56 175<br />
1993-94 5,288 1994-95 519 156 51 153<br />
1999-00 f 4,919 2000-01 f 518 163 50 137<br />
Total 15,261 Total 1,621 464 157 465<br />
General Education 1990-91 41,545 1991-92 4,156 1,311 419 888<br />
1993-94 41,706 1994-95 1,569 1,569 440 880<br />
1999-00 f 39,977 2000-01 f 1,726 1,726 561 1,047<br />
Total 123,228 Total 12,723 4,606 1,420 2,811<br />
Total 1990-91 46,599 91% 1991-92 4,740 97% / 92% 1,456 475 1,063<br />
1993-94 46,944 88% 1994-95 4,506 92% / 89% 1,725 491 1,033<br />
1999-00 f 44,896 83% g 2000-01 f 5,098 90% / 91% 1,889 611 1,184<br />
Total 138,439 Total 14,344 5,070 1,577 3,280<br />
a Schools <strong>and</strong> Staff<strong>in</strong>g Survey (SASS) <strong>and</strong> <strong>Teacher</strong> Follow-up Survey (TFS), both by the National Center for Education Statistics, USDE.<br />
b Includes stayers, as well as leavers, switchers, <strong>and</strong> movers.<br />
c Weighted response rates for public teachers.<br />
d Weighted response rates for public current teachers / former teachers<br />
e Some switchers <strong>in</strong>cluded <strong>in</strong> movers, <strong>and</strong> vice versa.<br />
f Includes regular public <strong>and</strong> charter public teachers.<br />
g Approximate rate for regular public <strong>and</strong> charter public comb<strong>in</strong>ed.