Great Torrington Community School & Sports College Profile
Great Torrington Community School & Sports College Profile
Great Torrington Community School & Sports College Profile

Create successful ePaper yourself
Turn your PDF publications into a flip-book with our unique Google optimized e-Paper software.
What are we trying to improve?<br />
In 2008/9 we are trying to improve:<br />
1.By providing more personalised learning:<br />
we have increased our KS4 options from 13 to 31 including day courses at NDC.<br />
we have a nurture group for very low attaining Y7 & Y8 learners with more specialised<br />
teaching to suit the learners' needs and fewer teachers.<br />
through enrichment opportunities for more able learners to realise their potential with an<br />
express group for Y7 learners in 2008 to ensure that there is enough curriculum challenge<br />
for them.<br />
through specialist T.As who have been put in post to advise on learners with complex needs.<br />
2.We expect to see these SEN groups of learners achieving as well as the rest of the school<br />
population as shown in Raiseonline data in 2008 onwards.<br />
3.Learners' attitudes have been improved through setting up more school leadership opportunites<br />
for learners and the demand for more consistency in and outside the classroom. Our own data for<br />
sanctions should decrease and rewards should increase.<br />
4.Learners' expectations have also been improved through a system of assertive mentoring<br />
and teachers' efforts to improve homework. We expect to see less underachievement in the public<br />
exams for Y9 and Y11 in 2008.<br />
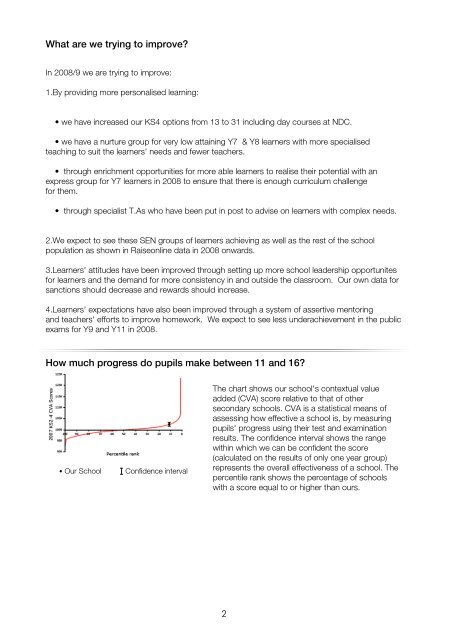
How much progress do pupils make between 11 and 16?<br />
Our <strong>School</strong><br />
Confidence interval<br />
The chart shows our school's contextual value<br />
added (CVA) score relative to that of other<br />
secondary schools. CVA is a statistical means of<br />
assessing how effective a school is, by measuring<br />
pupils' progress using their test and examination<br />
results. The confidence interval shows the range<br />
within which we can be confident the score<br />
(calculated on the results of only one year group)<br />
represents the overall effectiveness of a school. The<br />
percentile rank shows the percentage of schools<br />
with a score equal to or higher than ours.<br />
2