Antimicrobial effects of silver zeolite, silver zirconium phosphate ...
Antimicrobial effects of silver zeolite, silver zirconium phosphate ...
Antimicrobial effects of silver zeolite, silver zirconium phosphate ...

Create successful ePaper yourself
Turn your PDF publications into a flip-book with our unique Google optimized e-Paper software.
Sirikamon Saengmee-anupharb et al./Asian Pac J Trop Biomed 2013; 3(1): 47-52<br />
49<br />
stay for an hour to facilitate the diffusion <strong>of</strong> the drug<br />
solution. Then the plates were incubated at 37 °C for 24<br />
h. The antimicrobial activity was evaluated based on<br />
zones <strong>of</strong> growth inhibition (mm).<br />
2.4.2. Minimum inhibitory concentration (MIC) and<br />
minimum lethal concentration (MLC)<br />
The MIC and MLC were determined using the<br />
membrane method described by Tantaoui-Elaraki et<br />
al[11]. Briefly, serial dilutions <strong>of</strong> <strong>silver</strong> material and<br />
carrier suspensions, ranging from 1.0 to 200.0 g/L were<br />
prepared in Mueller Hinton agar. Cellulose acetate<br />
membrane filters (0.45 µm porosity) (Sartorius, Germany)<br />
were placed on the surface <strong>of</strong> the agar plate and 25 µL<br />
<strong>of</strong> each microbial suspension (10 8 CFU/mL for bacteria<br />
and 10 7 CFU/mL for yeast) was dropped onto each filter.<br />
The plates were incubated at 37 °C for 24 to 48 h. The<br />
MIC values were determined as the lowest concentration<br />
<strong>of</strong> suspension inhibiting the visible growth <strong>of</strong> each<br />
organism on the membranes.<br />
For the determination <strong>of</strong> MLC, cellulose acetate filters<br />
without any microbial growth were transferred into<br />
brain heart infusion (BHI) broth and incubated at 37 °C<br />
for 72 h. The lowest concentration <strong>of</strong> <strong>silver</strong> materials or<br />
carriers showing no visible growth <strong>of</strong> the organisms in<br />
the tube was considered as the MLC. All the tests were<br />
performed in triplicate on three separate occasions.<br />
Using the agar cup diffusion method as a screening<br />
test, all <strong>of</strong> <strong>silver</strong> materials showed antimicrobial<br />
<strong>effects</strong> against all <strong>of</strong> test organisms with a zone <strong>of</strong><br />
inhibition ranging from 7 to 21 mm (Table 1). No<br />
growth inhibition was observed when exposed to the<br />
carriers without <strong>silver</strong> (<strong>zeolite</strong>, <strong>zirconium</strong> <strong>phosphate</strong><br />
silicate and <strong>zirconium</strong> <strong>phosphate</strong>). The MICs and MLCs<br />
<strong>of</strong> <strong>silver</strong> materials are shown in Table 2. All the test<br />
microorganisms were inhibited and killed at >10.0 g/L <strong>of</strong><br />
<strong>silver</strong> materials except for that <strong>of</strong> AgZ against S. aureus,<br />
which exhibited the MLC value <strong>of</strong> 60.0 g/L.<br />
Table 2<br />
MIC and MLC <strong>of</strong> <strong>silver</strong> inorganic materials against test ed<br />
microorganisms.<br />
Materials<br />
Concentration (g/L)<br />
S. mutans L. casei C. albicans S. aureus<br />
MIC MLC MIC MLC MIC MLC MIC MLC<br />
AgZ 10.0 10.0 10.0 10.0 10.0 10.0 10.0 60.0<br />
Ag ZrPSi 10.0 10.0 10.0 10.0 10.0 10.0 10.0 10.0<br />
AgZrP 10.0 10.0 10.0 10.0 10.0 10.0 10.0 10.0<br />
3. Results<br />
Table 1<br />
Inhibition zone <strong>of</strong> <strong>silver</strong> inorganic materials against test<br />
microorganisms.<br />
Concentration<br />
Zone <strong>of</strong> inhibition (mm)<br />
Materials<br />
(g/L)<br />
S. mutans L. casei C. albicans S. aureus<br />
1.0 AgZ - - - -<br />
Ag ZrPSi - - - -<br />
AgZrP - - - -<br />
Zeolite - - - -<br />
ZrPSi - - - -<br />
10.0 AgZ 10 7 7 11<br />
Ag ZrPSi 17 9 9 8<br />
AgZrP 21 10 8 14<br />
Zeolite - - - -<br />
ZrPSi - - - -<br />
100.0 AgZ 15 17 17 13<br />
Ag ZrPSi 11 15 14 11<br />
AgZrP 9 15 12 12<br />
Zeolite - - - -<br />
ZrPSi - - - -<br />
200.0 AgZ 14 16 18 14<br />
Ag ZrPSi 11 15 15 12<br />
AgZrP 10 17 14 13<br />
Zeolite - - - -<br />
ZrPSi - - - -<br />
AgZrP<br />
AgZrPSi<br />
AgZ<br />
14 12 10 8 6 4 2<br />
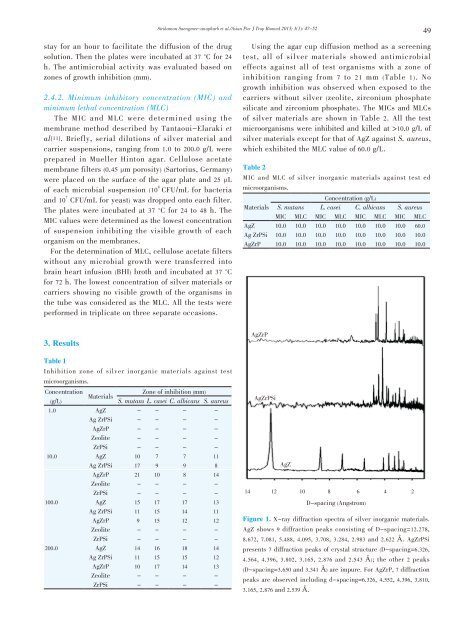
Figure 1. X-ray diffraction spectra <strong>of</strong> <strong>silver</strong> inorganic materials.<br />
AgZ shows 9 diffraction peaks consisting <strong>of</strong> D-spacing=12.278,<br />
8.672, 7.081, 5.488, 4.095, 3.708, 3.284, 2.983 and 2.622 Å. AgZrPSi<br />
presents 7 diffraction peaks <strong>of</strong> crystal structure (D-spacing=6.326,<br />
4.564, 4.396, 3.802, 3.165, 2.876 and 2.543 Å); the other 2 peaks<br />
(D-spacing=3.650 and 3.341 Å) are impure. For AgZrP, 7 diffraction<br />
peaks are observed including d-spacing=6.326, 4.552, 4.396, 3.810,<br />
3.165, 2.876 and 2.539 Å.<br />
D-spacing (Angstrom)