Biotechnology in Hungary and the Region
Biotechnology in Hungary and the Region
Biotechnology in Hungary and the Region

Create successful ePaper yourself
Turn your PDF publications into a flip-book with our unique Google optimized e-Paper software.
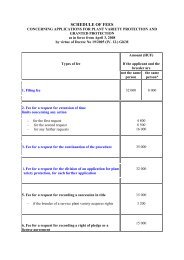
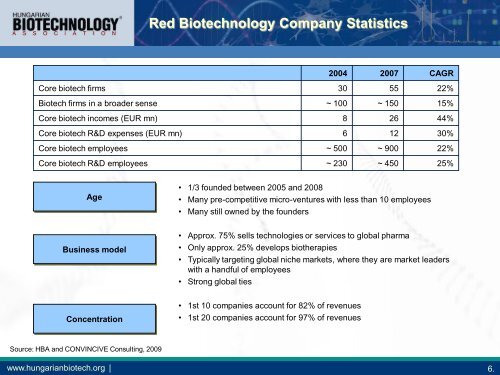
Red <strong>Biotechnology</strong> Company Statistics<br />
2004 2007 CAGR<br />
Core biotech firms 30 55 22%<br />
Biotech firms <strong>in</strong> a broader sense ~ 100 ~ 150 15%<br />
Core biotech <strong>in</strong>comes (EUR mn) 8 26 44%<br />
Core biotech R&D expenses (EUR mn) 6 12 30%<br />
Core biotech employees ~ 500 ~ 900 22%<br />
Core biotech R&D employees ~ 230 ~ 450 25%<br />
Age<br />
• 1/3 founded between 2005 <strong>and</strong> 2008<br />
• Many pre-competitive micro-ventures with less than 10 employees<br />
• Many still owned by <strong>the</strong> founders<br />
Bus<strong>in</strong>ess model<br />
• Approx. 75% sells technologies or services to global pharma<br />
• Only approx. 25% develops bio<strong>the</strong>rapies<br />
• Typically target<strong>in</strong>g global niche markets, where <strong>the</strong>y are market leaders<br />
with a h<strong>and</strong>ful of employees<br />
• Strong global ties<br />
Concentration<br />
• 1st 10 companies account for 82% of revenues<br />
• 1st 20 companies account for 97% of revenues<br />
Source: HBA <strong>and</strong> CONVINCIVE Consult<strong>in</strong>g, 2009<br />
www.hungarianbiotech.org | 6.