- Page 1 and 2:
South African Health Review 2008
- Page 3 and 4:
Information presented in this Revie
- Page 6 and 7:
Contents Editorial vii Primary Heal
- Page 8:
Acknowledgements Editors Peter Barr
- Page 11 and 12:
Primary Health Care was defined at
- Page 13 and 14:
ascribe to a lack of strong leaders
- Page 15 and 16:
References 1 Anso Thom and Kerry Cu
- Page 18 and 19:
International Perspective on Primar
- Page 20 and 21:
International Perspective on Primar
- Page 22 and 23:
International Perspective on Primar
- Page 24 and 25:
International Perspective on Primar
- Page 26 and 27:
International Perspective on Primar
- Page 28 and 29:
International Perspective on Primar
- Page 30 and 31:
International Perspective on Primar
- Page 32 and 33:
A Perspective on Primary Health Car
- Page 34 and 35:
A Perspective on Primary Health Car
- Page 36 and 37:
A Perspective on Primary Health Car
- Page 38 and 39:
A Perspective on Primary Health Car
- Page 40 and 41:
A Perspective on Primary Health Car
- Page 42 and 43:
A Perspective on Primary Health Car
- Page 44 and 45:
A Perspective on Primary Health Car
- Page 46 and 47:
Health Legislation and Policy 3 Aut
- Page 48 and 49:
Health Legislation and Policy 3 Th
- Page 50 and 51:
Health Legislation and Policy 3 (2)
- Page 52 and 53:
Health Legislation and Policy 3 The
- Page 54 and 55:
Health Legislation and Policy 3 ref
- Page 56 and 57:
Health Legislation and Policy 3 of
- Page 58 and 59:
Health Legislation and Policy 3 t
- Page 60 and 61:
Health Legislation and Policy 3
- Page 62 and 63:
Health Legislation and Policy 3 22
- Page 64:
Health Legislation and Policy 3 75
- Page 67 and 68:
Introduction The report of the Worl
- Page 69 and 70:
Culture South Africa is a multicult
- Page 71 and 72:
The Food and Agriculture Organizati
- Page 73 and 74:
A recent review by Biersteker and D
- Page 75 and 76:
Urbanisation and migration In spite
- Page 77 and 78:
Further analysis of the reported de
- Page 79 and 80:
Figure 11: Estimates of trend in th
- Page 81 and 82:
of school attendance have largely b
- Page 83 and 84:
28 Food and Agricultural Organizati
- Page 86:
71Primary Health Care: Programme Ar
- Page 89 and 90:
Introduction Chronic non-communicab
- Page 91 and 92:
Biological factors High blood chole
- Page 93 and 94:
Tobacco use Tobacco use is one of t
- Page 95 and 96:
It is important to develop comprehe
- Page 97 and 98:
The public health care system is th
- Page 99 and 100:
There is also lack of involvement o
- Page 101 and 102:
27 Kolbe-Alexander TL, Lambert EV,
- Page 104 and 105:
STIs, HIV and AIDS and TB: Progress
- Page 106 and 107:
STIs, HIV and AIDS and TB: Progress
- Page 108 and 109:
STIs, HIV and AIDS and TB: Progress
- Page 110 and 111:
STIs, HIV and AIDS and TB: Progress
- Page 112 and 113:
STIs, HIV and AIDS and TB: Progress
- Page 114 and 115:
STIs, HIV and AIDS and TB: Progress
- Page 116 and 117:
STIs, HIV and AIDS and TB: Progress
- Page 118 and 119:
Community Access to Mental Health S
- Page 120 and 121:
Community Access to Mental Health S
- Page 122 and 123:
Community Access to Mental Health S
- Page 124 and 125:
Community Access to Mental Health S
- Page 126 and 127:
Community Access to Mental Health S
- Page 128 and 129:
Community Access to Mental Health S
- Page 130 and 131:
Maternal, Newborn and Child Health:
- Page 132 and 133:
Maternal, Newborn and Child Health:
- Page 134 and 135:
Maternal, Newborn and Child Health:
- Page 136 and 137:
Maternal, Newborn and Child Health:
- Page 138 and 139:
Maternal, Newborn and Child Health:
- Page 140 and 141:
Maternal, Newborn and Child Health:
- Page 142 and 143:
Maternal, Newborn and Child Health:
- Page 144 and 145:
Nutrition: A Primary Health Care Pe
- Page 146 and 147:
Nutrition: A Primary Health Care Pe
- Page 148 and 149:
Nutrition: A Primary Health Care Pe
- Page 150 and 151:
Nutrition: A Primary Health Care Pe
- Page 152 and 153:
Nutrition: A Primary Health Care Pe
- Page 154 and 155:
Nutrition: A Primary Health Care Pe
- Page 156 and 157:
Nutrition: A Primary Health Care Pe
- Page 158 and 159:
Nutrition: A Primary Health Care Pe
- Page 160 and 161:
Nutrition: A Primary Health Care Pe
- Page 162 and 163:
Nutrition: A Primary Health Care Pe
- Page 164 and 165:
Developments in Environmental Healt
- Page 166 and 167:
Developments in Environmental Healt
- Page 168 and 169:
Developments in Environmental Healt
- Page 170 and 171:
Developments in Environmental Healt
- Page 172 and 173:
Developments in Environmental Healt
- Page 174 and 175:
Developments in Environmental Healt
- Page 176 and 177:
Primary Health Care… forms an int
- Page 178 and 179:
Strengthening Human Resources for P
- Page 180 and 181:
Strengthening Human Resources for P
- Page 182 and 183:
Strengthening Human Resources for P
- Page 184 and 185:
Strengthening Human Resources for P
- Page 186 and 187:
Strengthening Human Resources for P
- Page 188 and 189:
Strengthening Human Resources for P
- Page 190 and 191:
Strengthening Human Resources for P
- Page 192 and 193:
Strengthening Human Resources for P
- Page 194 and 195:
Primary Health Care Financing in th
- Page 196 and 197:
Primary Health Care Financing in th
- Page 198 and 199:
Primary Health Care Financing in th
- Page 200 and 201:
Primary Health Care Financing in th
- Page 202 and 203:
Primary Health Care Financing in th
- Page 204 and 205:
Primary Health Care Financing in th
- Page 206 and 207:
Primary Health Care Financing in th
- Page 208 and 209:
Primary Health Care Financing in th
- Page 210 and 211:
Information for Primary Health Care
- Page 212 and 213:
Information for Primary Health Care
- Page 214 and 215:
Information for Primary Health Care
- Page 216 and 217:
Information for Primary Health Care
- Page 218 and 219:
Information for Primary Health Care
- Page 220 and 221:
Information for Primary Health Care
- Page 222 and 223:
Information for Primary Health Care
- Page 224 and 225:
Information for Primary Health Care
- Page 226 and 227:
A Review of Health Research in Sout
- Page 228 and 229:
A Review of Health Research in Sout
- Page 230 and 231:
A Review of Health Research in Sout
- Page 232 and 233:
A Review of Health Research in Sout
- Page 234 and 235:
A Review of Health Research in Sout
- Page 236 and 237:
A Review of Health Research in Sout
- Page 238 and 239:
The Role of Private and Other Non-G
- Page 240 and 241:
The Role of Private and Other Non-G
- Page 242 and 243:
The Role of Private and Other Non-G
- Page 244 and 245:
The Role of Private and Other Non-G
- Page 246 and 247:
The Role of Private and Other Non-G
- Page 248 and 249:
The Role of Private and Other Non-G
- Page 250 and 251:
The Role of Private and Other Non-G
- Page 252 and 253:
Primary Health Care is essential he
- Page 254 and 255: Health and Related Indicators 16 Au
- Page 256 and 257: Health and Related Indicators 16 In
- Page 258 and 259: Health and Related Indicators 16
- Page 260 and 261: Health and Related Indicators 16 Av
- Page 262 and 263: Health and Related Indicators 16 De
- Page 264 and 265: Health and Related Indicators 16 EC
- Page 266 and 267: Health and Related Indicators 16 Af
- Page 268 and 269: NC066 NC065 NCDMA08 NC071 NC074 LIM
- Page 270 and 271: Health and Related Indicators 16 Fi
- Page 272 and 273: Health and Related Indicators 16 Ta
- Page 274 and 275: Health and Related Indicators 16 Pr
- Page 276 and 277: Health and Related Indicators 16 Ea
- Page 278 and 279: Health and Related Indicators 16 Fr
- Page 280 and 281: Health and Related Indicators 16 Ga
- Page 282 and 283: Health and Related Indicators 16 Kw
- Page 284 and 285: Health and Related Indicators 16 Li
- Page 286 and 287: Health and Related Indicators 16 Mp
- Page 288 and 289: Health and Related Indicators 16 No
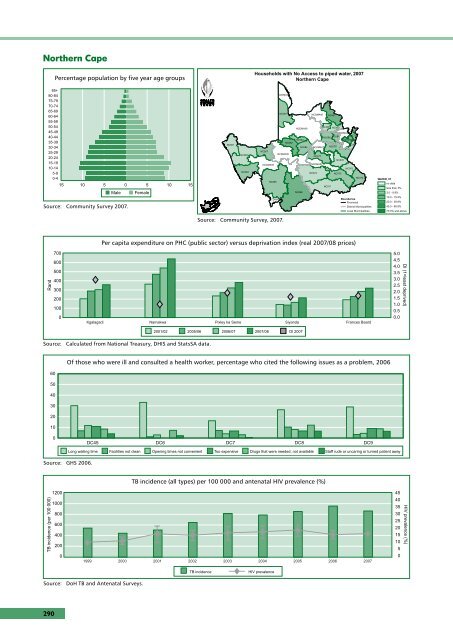
- Page 290 and 291: Health and Related Indicators 16 No
- Page 292 and 293: Health and Related Indicators 16 We
- Page 294 and 295: Health and Related Indicators 16 Di
- Page 296 and 297: Health and Related Indicators 16 Di
- Page 298 and 299: Health and Related Indicators 16 Di
- Page 300 and 301: Health and Related Indicators 16 Di
- Page 302 and 303: Health and Related Indicators 16 Di
- Page 306 and 307: Health and Related Indicators 16 Di
- Page 308 and 309: Health and Related Indicators 16 Di
- Page 310 and 311: Health and Related Indicators 16 Di
- Page 312 and 313: Health and Related Indicators 16 77
- Page 314 and 315: Health and Related Indicators 16 Di
- Page 316 and 317: Health and Related Indicators 16 In
- Page 318 and 319: Health and Related Indicators 16
- Page 320 and 321: Health and Related Indicators 16 Ta
- Page 322 and 323: Health and Related Indicators 16 Ma
- Page 324 and 325: Health and Related Indicators 16 HI
- Page 326 and 327: Health and Related Indicators 16 90
- Page 328 and 329: Health and Related Indicators 16 gr
- Page 330 and 331: Health and Related Indicators 16 EC
- Page 332 and 333: Health and Related Indicators 16 Ta
- Page 334 and 335: Health and Related Indicators 16 Ta
- Page 336 and 337: Health and Related Indicators 16 Ba
- Page 338 and 339: Health and Related Indicators 16 EC
- Page 340 and 341: Health and Related Indicators 16 Ta
- Page 342 and 343: Health and Related Indicators 16 Ta
- Page 344 and 345: Health and Related Indicators 16 Fi
- Page 346 and 347: Health and Related Indicators 16 Ta
- Page 348 and 349: Health and Related Indicators 16 Ta
- Page 350 and 351: Health and Related Indicators 16 so
- Page 352 and 353: Health and Related Indicators 16 Ch
- Page 354 and 355:
Health and Related Indicators 16 No
- Page 356 and 357:
Health and Related Indicators 16 Me
- Page 358 and 359:
Health and Related Indicators 16 Fi
- Page 360 and 361:
Health and Related Indicators 16 EC
- Page 362 and 363:
Health and Related Indicators 16 Th
- Page 364 and 365:
Health and Related Indicators 16 EC
- Page 366 and 367:
Health and Related Indicators 16 Ta
- Page 368 and 369:
Health and Related Indicators 16 Fi
- Page 370 and 371:
Health and Related Indicators 16 Ta
- Page 372 and 373:
Health and Related Indicators 16 He
- Page 374 and 375:
Health and Related Indicators 16 Ta
- Page 376 and 377:
Health and Related Indicators 16 EC
- Page 378 and 379:
Health and Related Indicators 16 Ta
- Page 380 and 381:
Health and Related Indicators 16 Ta
- Page 382 and 383:
Health and Related Indicators 16 He
- Page 384 and 385:
Health and Related Indicators 16 Ta
- Page 386 and 387:
Health and Related Indicators 16 Ta
- Page 388 and 389:
Health and Related Indicators 16 Di
- Page 390 and 391:
Health and Related Indicators 16 20
- Page 392 and 393:
Health and Related Indicators 16 In
- Page 394 and 395:
Health and Related Indicators 16 Ta
- Page 396 and 397:
Health and Related Indicators 16 In
- Page 398 and 399:
Health and Related Indicators 16 Ty
- Page 400 and 401:
Health and Related Indicators 16 Ty
- Page 402 and 403:
Health and Related Indicators 16 Re
- Page 404 and 405:
Health and Related Indicators 16 Do
- Page 406 and 407:
Health and Related Indicators 16 La
- Page 408 and 409:
Health and Related Indicators 16 SA
- Page 410 and 411:
Health and Related Indicators 16 Wo
- Page 412 and 413:
Glossary AFRO AIDS ANC ANHP ARI ART
- Page 414 and 415:
GOBI-FFF GP HAART HASA HDI Growth M
- Page 416 and 417:
PTB QRS R2C RAWP RCH RDP REF RPL RP
- Page 418 and 419:
Index A Acts (Legislation and Bills
- Page 420 and 421:
Developing countries 4-7, 9, 10, 57
- Page 422 and 423:
407