IFPI Recording Industry In Numbers 2009 â China
IFPI Recording Industry In Numbers 2009 â China
IFPI Recording Industry In Numbers 2009 â China

Create successful ePaper yourself
Turn your PDF publications into a flip-book with our unique Google optimized e-Paper software.
<strong>IFPI</strong> <strong>Recording</strong> <strong><strong>In</strong>dustry</strong> <strong>In</strong> <strong>Numbers</strong> <strong>2009</strong> – <strong>China</strong><br />
59<br />
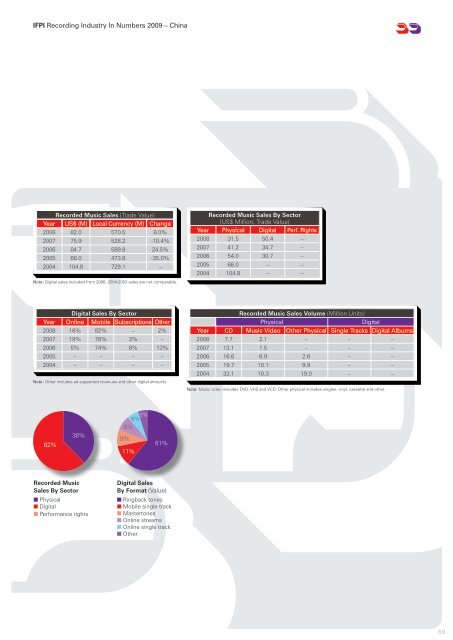
Recorded Music Sales (Trade Value)<br />
Year US$ (M) Local Currency (M) Change<br />
2008 82.0 570.5 8.0%<br />
2007 75.9 528.2 -10.4%<br />
2006 84.7 589.8 24.5%<br />
2005 68.0 473.6 -35.0%<br />
2004 104.8 729.1 –<br />
Note: Digital sales included from 2006. 2004-2003 sales are not comparable.<br />
Recorded Music Sales By Sector<br />
(US$ Million, Trade Value)<br />
Year Physical Digital Perf. Rights<br />
2008 31.5 50.4 –<br />
2007 41.2 34.7 –<br />
2006 54.0 30.7 –<br />
2005 68.0 – –<br />
2004 104.8 – –<br />
Digital Sales By Sector<br />
Year Online Mobile Subscriptions Other<br />
2008 16% 82% – 2%<br />
2007 19% 78% 3% –<br />
2006 5% 74% 8% 13%<br />
2005 – – – –<br />
2004 – – – –<br />
Note: Other includes ad-supported revenues and other digital amounts.<br />
3<br />
6<br />
Recorded Music Sales Volume (Million Units)<br />
Physical<br />
Digital<br />
Year CD Music Video Other Physical Single Tracks Digital Albums<br />
2008 7.7 2.1 – – –<br />
2007 13.1 1.5 – – –<br />
2006 16.6 6.9 2.6 – –<br />
2005 19.7 10.1 9.9 – –<br />
2004 33.1 10.3 19.0 – –<br />
Note: Music video includes DVD, VHS and VCD. Other physical includes singles, vinyl, cassette and other.<br />
62%<br />
38%<br />
6% 5%<br />
8%<br />
9%<br />
11%<br />
61%<br />
Recorded Music<br />
Sales By Sector<br />
n Physical<br />
n Digital<br />
n Performance rights<br />
Digital Sales<br />
By Format (Value)<br />
n Ringback tones<br />
n Mobile single track<br />
n Mastertones<br />
n Online streams<br />
n Online single track<br />
n Other<br />
59