hybrid datagathering scheme for energy efficient wireless sensor ...
hybrid datagathering scheme for energy efficient wireless sensor ...
hybrid datagathering scheme for energy efficient wireless sensor ...

You also want an ePaper? Increase the reach of your titles
YUMPU automatically turns print PDFs into web optimized ePapers that Google loves.
A Muthu Krishnan et al ,Int.J.Computer Technology & Applications,Vol 4 (1), 51-57<br />
ISSN:2229-6093<br />
The proposed system by default is in the event driven<br />
mode. Event driven data gathering is mainly applied to<br />
detect the occurrence of an event. If an event occurs the<br />
system initiates the task of reporting. This helps in<br />
<strong>wireless</strong> <strong>sensor</strong> node to preserve the battery <strong>energy</strong>. The<br />
system is in idle listening mode until an event occurs. On<br />
the occurrence of an event, the system switches to data<br />
driven reporting <strong>scheme</strong>. To fulfill these requirements,<br />
there must be a mechanism to determine in a timely<br />
manner when to switch between the two data-reporting<br />
<strong>scheme</strong>s and which <strong>sensor</strong> nodes to involve in the timedriven<br />
data-reporting process. Depending on these<br />
answers, several policies can exist. In this paper, we<br />
present two algorithms: the PED algorithm and the PAD<br />
algorithm.<br />
A. PED Algorithm<br />
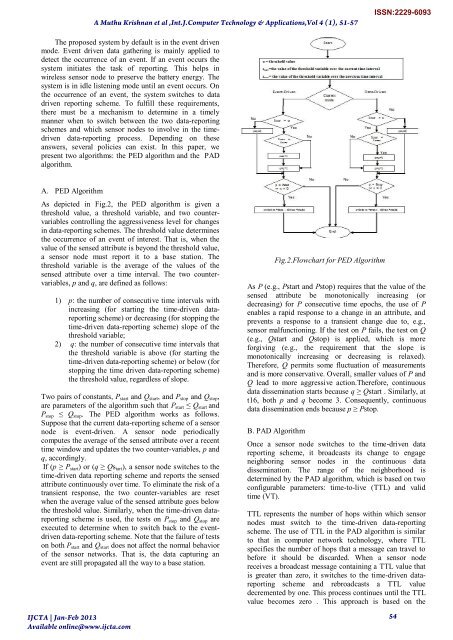
As depicted in Fig.2, the PED algorithm is given a<br />
threshold value, a threshold variable, and two countervariables<br />
controlling the aggressiveness level <strong>for</strong> changes<br />
in data-reporting <strong>scheme</strong>s. The threshold value determines<br />
the occurrence of an event of interest. That is, when the<br />
value of the sensed attribute is beyond the threshold value,<br />
a <strong>sensor</strong> node must report it to a base station. The<br />
threshold variable is the average of the values of the<br />
sensed attribute over a time interval. The two countervariables,<br />
p and q, are defined as follows:<br />
1) p: the number of consecutive time intervals with<br />
increasing (<strong>for</strong> starting the time-driven datareporting<br />
<strong>scheme</strong>) or decreasing (<strong>for</strong> stopping the<br />
time-driven data-reporting <strong>scheme</strong>) slope of the<br />
threshold variable;<br />
2) q: the number of consecutive time intervals that<br />
the threshold variable is above (<strong>for</strong> starting the<br />
time-driven data-reporting <strong>scheme</strong>) or below (<strong>for</strong><br />
stopping the time driven data-reporting <strong>scheme</strong>)<br />
the threshold value, regardless of slope.<br />
Two pairs of constants, P start and Q start , and P stop and Q stop ,<br />
are parameters of the algorithm such that P start ≤ Q start and<br />
P stop ≤ Q stop . The PED algorithm works as follows.<br />
Suppose that the current data-reporting <strong>scheme</strong> of a <strong>sensor</strong><br />
node is event-driven. A <strong>sensor</strong> node periodically<br />
computes the average of the sensed attribute over a recent<br />
time window and updates the two counter-variables, p and<br />
q, accordingly.<br />
If (p ≥ P start ) or (q ≥ Qs tart ), a <strong>sensor</strong> node switches to the<br />
time-driven data reporting <strong>scheme</strong> and reports the sensed<br />
attribute continuously over time. To eliminate the risk of a<br />
transient response, the two counter-variables are reset<br />
when the average value of the sensed attribute goes below<br />
the threshold value. Similarly, when the time-driven datareporting<br />
<strong>scheme</strong> is used, the tests on P stop and Q stop are<br />
executed to determine when to switch back to the eventdriven<br />
data-reporting <strong>scheme</strong>. Note that the failure of tests<br />
on both P start and Q start does not affect the normal behavior<br />
of the <strong>sensor</strong> networks. That is, the data capturing an<br />
event are still propagated all the way to a base station.<br />
IJCTA | Jan-Feb 2013<br />
Available online@www.ijcta.com<br />
Fig.2.Flowchart <strong>for</strong> PED Algorithm<br />
As P (e.g., Pstart and Pstop) requires that the value of the<br />
sensed attribute be monotonically increasing (or<br />
decreasing) <strong>for</strong> P consecutive time epochs, the use of P<br />
enables a rapid response to a change in an attribute, and<br />
prevents a response to a transient change due to, e.g.,<br />
<strong>sensor</strong> malfunctioning. If the test on P fails, the test on Q<br />
(e.g., Qstart and Qstop) is applied, which is more<br />
<strong>for</strong>giving (e.g., the requirement that the slope is<br />
monotonically increasing or decreasing is relaxed).<br />
There<strong>for</strong>e, Q permits some fluctuation of measurements<br />
and is more conservative. Overall, smaller values of P and<br />
Q lead to more aggressive action.There<strong>for</strong>e, continuous<br />
data dissemination starts because q ≥ Qstart . Similarly, at<br />
t16, both p and q become 3. Consequently, continuous<br />
data dissemination ends because p ≥ Pstop.<br />
B. PAD Algorithm<br />
Once a <strong>sensor</strong> node switches to the time-driven data<br />
reporting <strong>scheme</strong>, it broadcasts its change to engage<br />
neighboring <strong>sensor</strong> nodes in the continuous data<br />
dissemination. The range of the neighborhood is<br />
determined by the PAD algorithm, which is based on two<br />
configurable parameters: time-to-live (TTL) and valid<br />
time (VT).<br />
TTL represents the number of hops within which <strong>sensor</strong><br />
nodes must switch to the time-driven data-reporting<br />
<strong>scheme</strong>. The use of TTL in the PAD algorithm is similar<br />
to that in computer network technology, where TTL<br />
specifies the number of hops that a message can travel to<br />
be<strong>for</strong>e it should be discarded. When a <strong>sensor</strong> node<br />
receives a broadcast message containing a TTL value that<br />
is greater than zero, it switches to the time-driven datareporting<br />
<strong>scheme</strong> and rebroadcasts a TTL value<br />
decremented by one. This process continues until the TTL<br />
value becomes zero . This approach is based on the<br />
54