A COUNTRY PROFILE Bt CoËon In India - India Environment Portal
A COUNTRY PROFILE Bt CoËon In India - India Environment Portal
A COUNTRY PROFILE Bt CoËon In India - India Environment Portal
You also want an ePaper? Increase the reach of your titles
YUMPU automatically turns print PDFs into web optimized ePapers that Google loves.
IV<br />
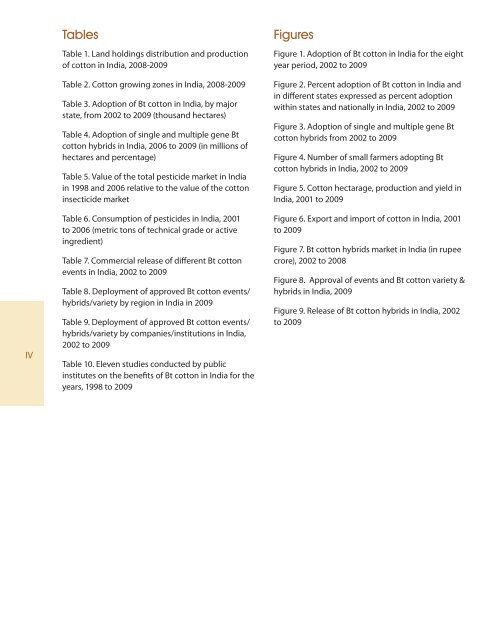
Tables<br />
Table 1. Land holdings distribution and production<br />
of cotton in <strong>In</strong>dia, 2008-2009<br />
Table 2. Cotton growing zones in <strong>In</strong>dia, 2008-2009<br />
Table 3. Adoption of <strong>Bt</strong> cotton in <strong>In</strong>dia, by major<br />
state, from 2002 to 2009 (thousand hectares)<br />
Table 4. Adoption of single and multiple gene <strong>Bt</strong><br />
cotton hybrids in <strong>In</strong>dia, 2006 to 2009 (in millions of<br />
hectares and percentage)<br />
Table 5. Value of the total pesticide market in <strong>In</strong>dia<br />
in 1998 and 2006 relative to the value of the cotton<br />
insecticide market<br />
Table 6. Consumption of pesticides in <strong>In</strong>dia, 2001<br />
to 2006 (metric tons of technical grade or active<br />
ingredient)<br />
Table 7. Commercial release of different <strong>Bt</strong> cotton<br />
events in <strong>In</strong>dia, 2002 to 2009<br />
Table 8. Deployment of approved <strong>Bt</strong> cotton events/<br />
hybrids/variety by region in <strong>In</strong>dia in 2009<br />
Table 9. Deployment of approved <strong>Bt</strong> cotton events/<br />
hybrids/variety by companies/institutions in <strong>In</strong>dia,<br />
2002 to 2009<br />
Table 10. Eleven studies conducted by public<br />
institutes on the benefits of <strong>Bt</strong> cotton in <strong>In</strong>dia for the<br />
years, 1998 to 2009<br />
Figures<br />
Figure 1. Adoption of <strong>Bt</strong> cotton in <strong>In</strong>dia for the eight<br />
year period, 2002 to 2009<br />
Figure 2. Percent adoption of <strong>Bt</strong> cotton in <strong>In</strong>dia and<br />
in different states expressed as percent adoption<br />
within states and nationally in <strong>In</strong>dia, 2002 to 2009<br />
Figure 3. Adoption of single and multiple gene <strong>Bt</strong><br />
cotton hybrids from 2002 to 2009<br />
Figure 4. Number of small farmers adopting <strong>Bt</strong><br />
cotton hybrids in <strong>In</strong>dia, 2002 to 2009<br />
Figure 5. Cotton hectarage, production and yield in<br />
<strong>In</strong>dia, 2001 to 2009<br />
Figure 6. Export and import of cotton in <strong>In</strong>dia, 2001<br />
to 2009<br />
Figure 7. <strong>Bt</strong> cotton hybrids market in <strong>In</strong>dia (in rupee<br />
crore), 2002 to 2008<br />
Figure 8. Approval of events and <strong>Bt</strong> cotton variety &<br />
hybrids in <strong>In</strong>dia, 2009<br />
Figure 9. Release of <strong>Bt</strong> cotton hybrids in <strong>In</strong>dia, 2002<br />
to 2009


